SJI Reports First Quarter 2019 Results; Initiates 2020 Guidance
Newsroom >
South Jersey Industries News
FOLSOM, NJ (May 8, 2019) - SJI (NYSE: SJI) today reported operating results for its 2019 first quarter ended March 31, 2019. Highlights include:
- First Quarter 2019 GAAP earnings per diluted share of $0.94 per share compared to $1.40 in 2018
- First Quarter 2019 Economic Earnings* per diluted share of $1.09 compared to $1.26 in 2018
- First quarter 2019 results reflect increased profitability from SJIU, Midstream and Energy Services offset by decreased profitability from Energy Group and impact of acquisition-related financing activities
- Business transformation on track, focused on balance sheet strengthening activities and execution of regulatory initiatives including ETG infrastructure replacement proposal and base rate case filing
- 2019 economic earnings per diluted share guidance of $1.05-$1.15 reaffirmed, driven by regulated operations
- 2020 economic earnings per diluted share guidance of $1.53-$1.67, driven by growth from regulated operations, regulatory initiatives and business transformation benefits
“Our first quarter results largely reflect 2019 transition-year timing pressures associated with our business transformation plan,” said Michael Renna, SJI President and Chief Executive Officer. "Our 2020 economic earnings guidance is a significant increase compared with 2019, and is built on a solid foundation driven by our regulated operations. We are excited about our future, and look forward to providing safe, reliable and low-cost natural gas to our customers and driving exceptional value for our shareholders for years to come," added Renna.
First Quarter 2019 Results
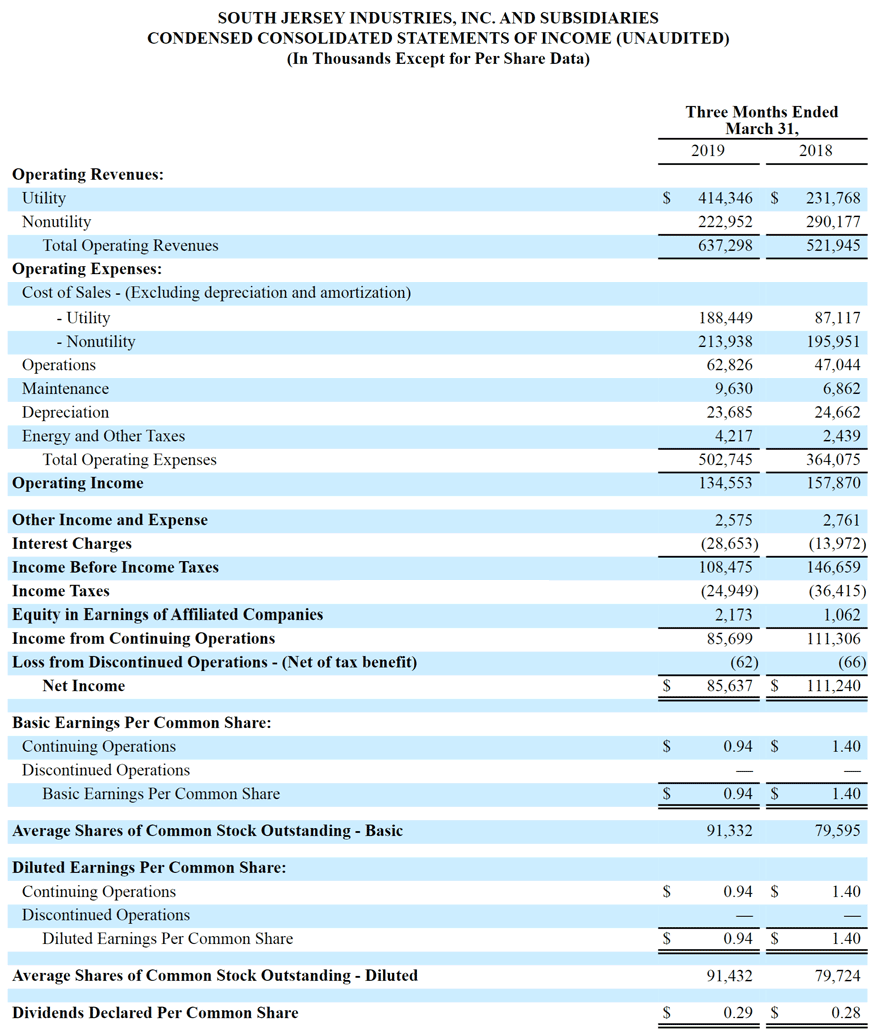
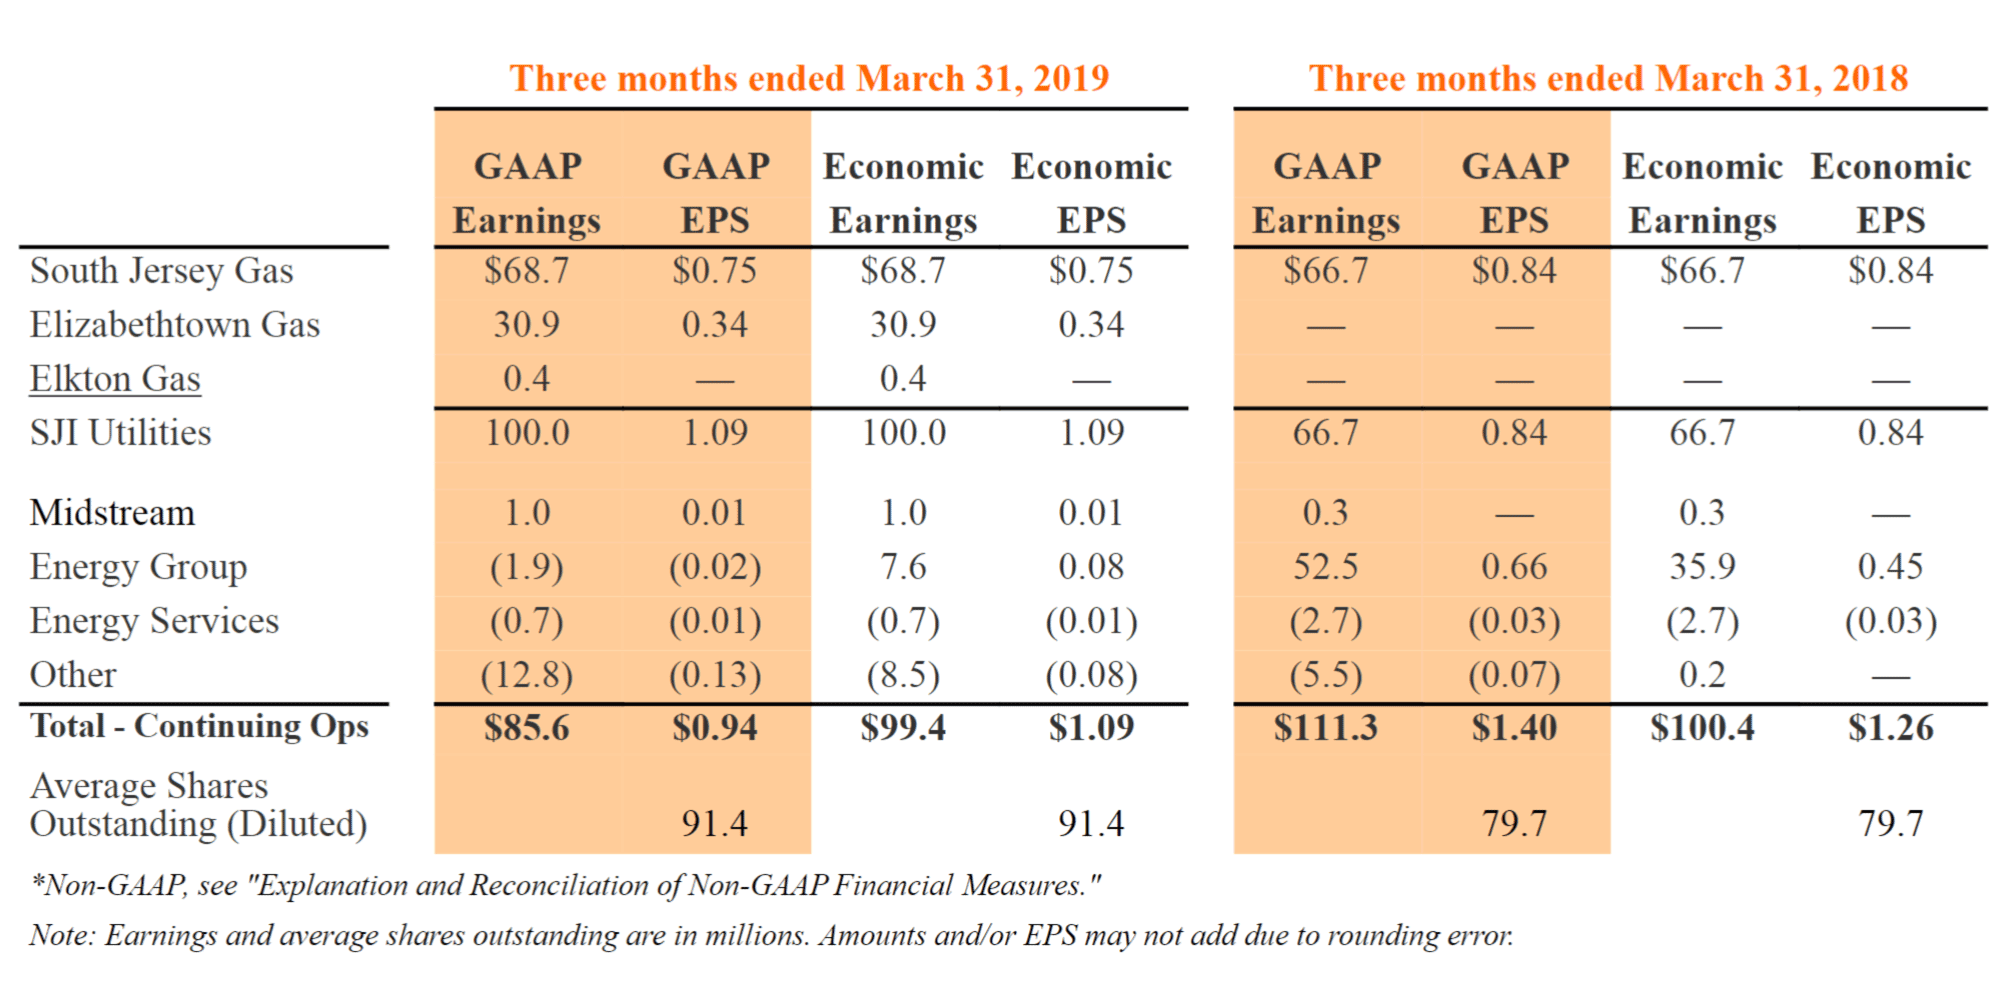
For the three-month period ended March 31, 2019, SJI reported consolidated GAAP earnings of $85.6 million ($0.94 per share) compared to $111.3 million ($1.40 per share) in the prior year period.
SJI uses the non-GAAP measure of Economic Earnings when discussing results. We believe this presentation provides clarity into the continuing earnings of our business. A full explanation and reconciliation of economic earnings is provided under “Explanation and Reconciliation of Non-GAAP Financial Measures” later in this report and in our 10-K for the year ending December 31, 2018.
For the three-month period ended March 31, 2019, economic earnings were $99.4 million ($1.09 per share) compared to $100.4 million ($1.26 per share) last year.
SJI Utilities
The SJI Utilities (SJIU) segment includes the gas distribution operations of SJG, ETG and ELK. GAAP earnings and economic earnings are the same for SJG, ETG and ELK. Given partial year contributions from ETG and ELK, earnings performance relative to the prior year is not comparable. First quarter 2019 earnings were $100.0 million. First quarter 2019 GAAP and economic earnings reflect the addition of Elizabethtown Gas and Elkton Gas operating activities which contributed $31.3 million to earnings.
South Jersey Gas
Operating Performance.
First quarter 2019 earnings were $68.7 million compared with $66.7 million in 2018. The $2.0 million improvement reflects higher utility margin partially offset by higher operating costs.
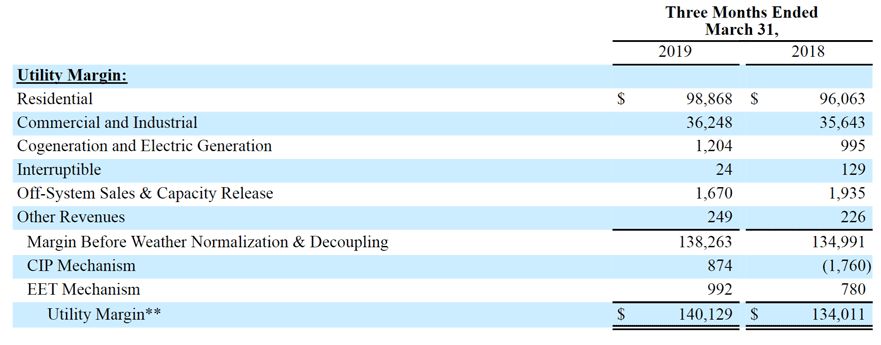
Utility margin increased $6.1 million during first quarter 2019 compared with 2018. We define utility margin, a non-GAAP measure, as natural gas revenues less natural gas costs, regulatory rider expenses and related volumetric and revenue-based energy taxes. Margin improvement was driven by customer growth and the roll-in of investments from infrastructure replacement programs. Margin gains were partially offset by higher depreciation, interest and operation and maintenance expenses primarily aimed at improving efficiency and productivity for the benefit of our customers.
Customer Growth.
SJG added approximately 7,400 new customers over the last 12 months and now serves more than 393,000 customers. SJG’s 1.9% growth rate compares favorably to our peers and remains driven by gas conversions (~75% of new customer additions) from alternate fuels such as oil and propane.
Infrastructure Modernization.
Through infrastructure replacement programs, SJG enhances the safety and reliability of our system while earning our authorized utility return on approved investments in a timely manner.
-
Our Accelerated Infrastructure Replacement Program (AIRP), as approved by the New Jersey Board of Public Utilities (NJBPU), authorizes investment of $302.5 million over the five year period from 2016-2021 for important infrastructure replacement upgrades. Our most recent annual investment of $60.4 million for the period July 2017 to June 2018 was rolled into SJG rates effective October 1, 2018.
- Our current Storm Hardening and Reliability Program (SHARP) was approved by the NJBPU in May 2018 and authorizes investment of $100 million from 2018-2021 for four projects to enhance the safety, redundancy and resiliency of the distribution system along our coastal communities. We expect to invest more than $45 million in 2019 under this program.
Redundancy Projects.
In response to the NJBPU's call for utilities to evaluate preparedness for supply interruptions, we are evaluating potential redundancy solutions. These projects are important to ensure service is not interrupted to customers in the event of a significant outage, either behind our city gate, or on one of the two interstate pipelines that serve the SJG system.
-
Supply Redundancy: LNG Facility. As previously discussed in October, supply redundancy is a top priority for our utilities, particularly SJG. Over the past several months we have evaluated multiple options including redundant supply feeds and large scale storage and liquefaction. We are moving into the design phase and will provide additional specifics regarding the project in the coming months.
- System Redundancy: Cape May. Earlier this year RC Cape May Holdings, LLC communicated the firm’s intent not to proceed with re-powering the former BL England facility with natural gas. SJG's proposed ~$115 million, 22-mile intrastate pipeline project would have supplied natural gas to the BL England generating facility and provided a secondary supply of natural gas to more than 142,000 customers in Atlantic and Cape May counties who are currently served by a single feed. We are exploring several system alternatives that will allow for a secondary supply of natural gas, needed to create reliability and resiliency for these customers. We expect to share details as these alternatives continue to clarify in the coming months.
Elizabethtown Gas
Operating Performance.
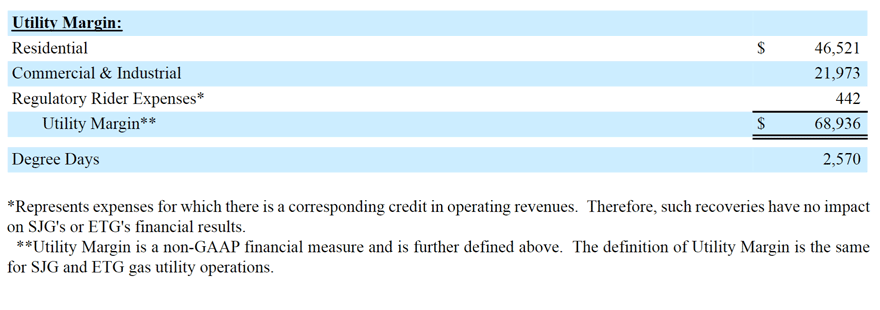
First quarter 2019 earnings were $30.9 million. As a reminder, given partial year contributions from our acquisition of ETG on July 1, 2018, first quarter 2019 earnings performance relative to the prior year is not comparable. Utility margin of $68.9 million was driven by customer growth offset by costs associated with the planned exit of the company’s current transition service agreement with Southern Company (SO) and interest expense.
Customer Growth.
ETG added approximately 2,500 net customers over the last 12 months and now serves more than 293,000 customers. ETG’s 0.9% growth rate has historically been driven by a balanced mix of new construction and gas conversions from alternate fuels such as oil and propane.
Infrastructure Modernization.
Consistent with acquisition approval, ETG was required to develop a plan, in concert with the Staff of the NJBPU, to address aging infrastructure at ETG. On October 29, 2018 ETG filed a $518 million, five-year infrastructure replacement program proposal with the NJBPU. The design of ETG's Infrastructure Investment Plan (IIP) includes a request for timely recovery of our investment through a separate rider recovery mechanism. We have begun settlement discussions and expect a final decision from the NJBPU in 2019.
Base Rate Case.
Delivering safe, reliable, affordable natural gas service requires investments to replace aging mains, support compliance with State and Federal system integrity and safety regulations, and implement measures that improve the overall ETG customer experience. In April, ETG filed a petition with the NJBPU requesting a revenue increase of approximately $65 million to recognize the infrastructure investments made to maintain the safety and reliability of its natural gas delivery system. The request represents approximately $346 million in system improvements that are not currently reflected in base rates. ETG's request assumes an overall rate of return of 7.6%, a return on equity of 10.4% and a 52.5% equity ratio. We expect settlement discussions to begin later this year followed by a final order, in line with precedent from prior cases.
Elkton Gas
First quarter 2019 earnings were $0.4 million. As a reminder, given partial year contributions from our acquisition of ELK on July 1, 2018, first quarter 2019 earnings performance relative to the prior year is not comparable. Utility margin from customer growth, infrastructure investment and rate relief was offset by operating costs and interest expense. In June 2018, ELK filed a base rate case application with the Maryland Public Service Commission (MPSC). In February 2019, the MPSC authorized an annual revenue increase of $0.09 million based on a 9.8% ROE and 50.0% equity component.
Midstream
GAAP and economic earnings are the same for Midstream. The Midstream segment is comprised of our 20% equity investment in the PennEast Pipeline (PennEast), a planned $1B+, 1 Bcf, approximately 120-mile interstate pipeline running from the Marcellus region of Pennsylvania into New Jersey. First quarter 2019 earnings were $1.0 million compared with $0.3 million in 2018, reflecting Allowance for Funds Used During Construction (AFUDC) related to the project.
Energy Group
Energy Group includes our non-regulated operations engaged in fuel supply management services, wholesale gas marketing, and retail marketing. First quarter 2019 GAAP earnings were a loss of $1.9 million compared with income of $52.5 million in 2018. First quarter 2019 economic earnings were $7.6 million compared with $35.9 million in 2018.
- Fuel management activities contributed first quarter 2019 economic earnings of $2.8 million, consistent with results in 2018. SJI currently serves a portfolio of eight operating contracts.
- Wholesale marketing contributed first quarter 2019 economic earnings of $4.4 million compared with $33.3 million in 2018. The significant decline in results reflects lower margins on daily energy trading activities tied to tighter spreads, lack of sustained cold weather and associated volatility and new pipeline operating rules that limited asset optimization opportunities. First quarter 2019 results were also impacted by headwinds associated with several legacy contracts, which begin to roll off in 2020.
- Retail marketing contributed first quarter 2019 economic earnings of $0.3 million compared with a loss of $0.1 million in 2018 driven by the sale of our retail gas marketing business in December 2018 to UGI Energy Services as part of our shift in business strategy.
Energy Services
Energy Services consists of our non-regulated energy production portfolio including solar, combined heat and power (CHP) and landfill gas-to-electric assets, as well as our account services business. First quarter 2019 GAAP and economic earnings were a loss of $0.7 million compared with a loss of $2.7 million in 2018.
- Energy production contributed a loss in first quarter 2019 economic earnings of $1.3 million compared with a loss of $3.2 million in 2018 driven by the sale of our solar assets in June 2018 to an entity managed by Goldman Sachs Asset Management (GSAM).
- Account services contributed first quarter 2019 economic earnings of $0.6 million compared with $0.5 million in 2018, partially mitigating energy production results.
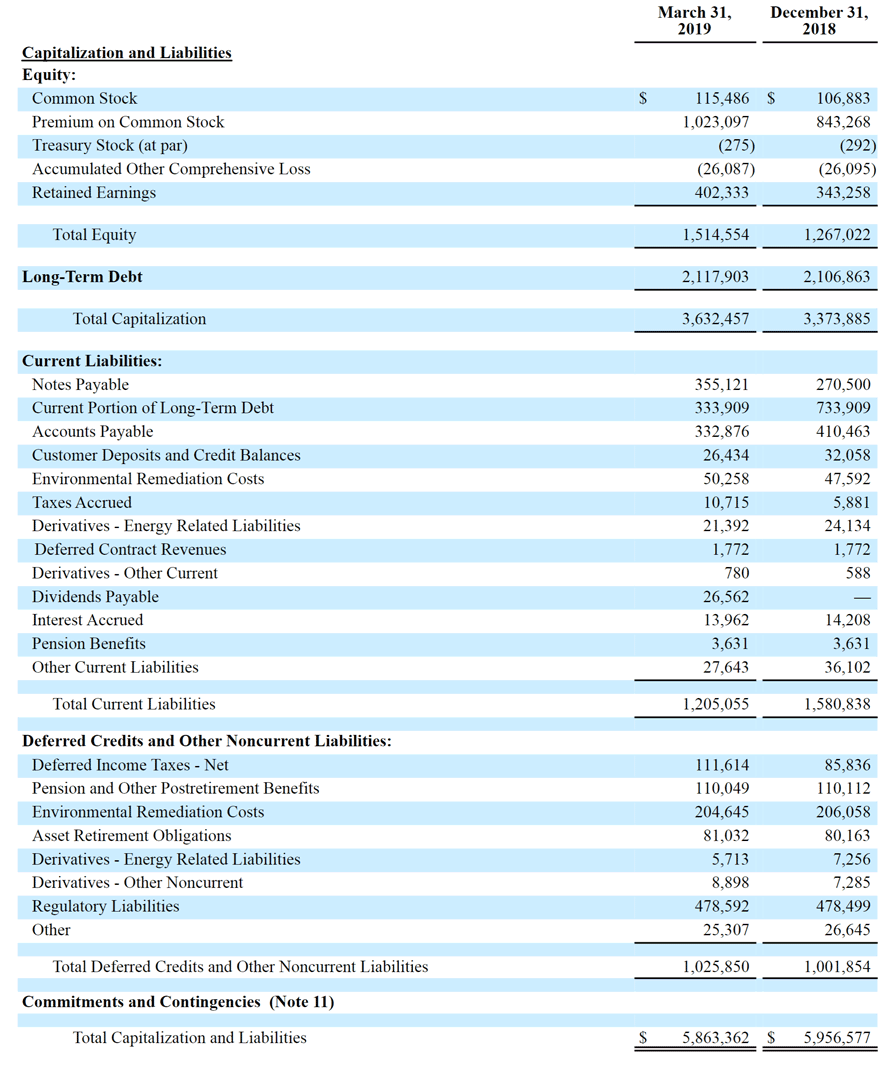
Balance Sheet and Cash Flow
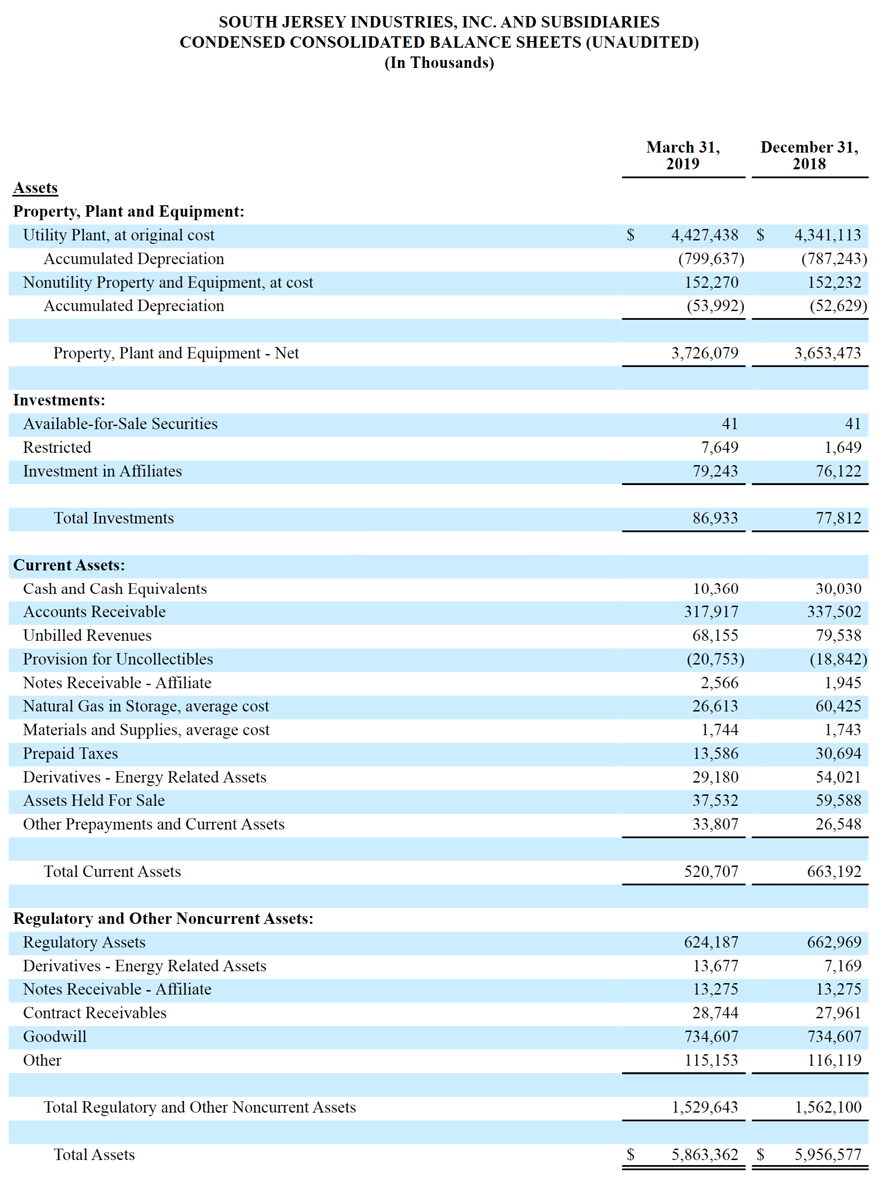
SJI remains committed to a capital structure that supports our regulated-driven capital spending plan while maintaining a balanced equity-to-total capitalization, ample liquidity and a solid investment grade credit rating. At March 31, 2019, equity-to-total capitalization was 35.1% compared with 28.9% at December 31, 2018, reflecting acquisition financing and debt repayment using proceeds from non-core asset sales. As previously communicated, our growth plan embeds conversion of mandatory convertible equity units due 2021 ($287.5 million). Including conversion, our adjusted equity-to-total capitalization ratio, a non-GAAP measure, was 39.1% at March 31, 2019 and 35.3% at December 31, 2018.
Our balance sheet strengthening activities remain a core focus and have continued into 2019. In January, we settled our equity forward sale agreement by physically delivering 6,779,661 shares of common stock and receiving net cash proceeds of approximately $189 million. We deployed a majority of these proceeds for debt repayment in late January. We have also deployed a majority of more than $300 million in cash proceeds from the sale of our solar and retail gas marketing assets for debt repayment. We expect additional debt repayment from the sale of any additional non-core, non-regulated assets.
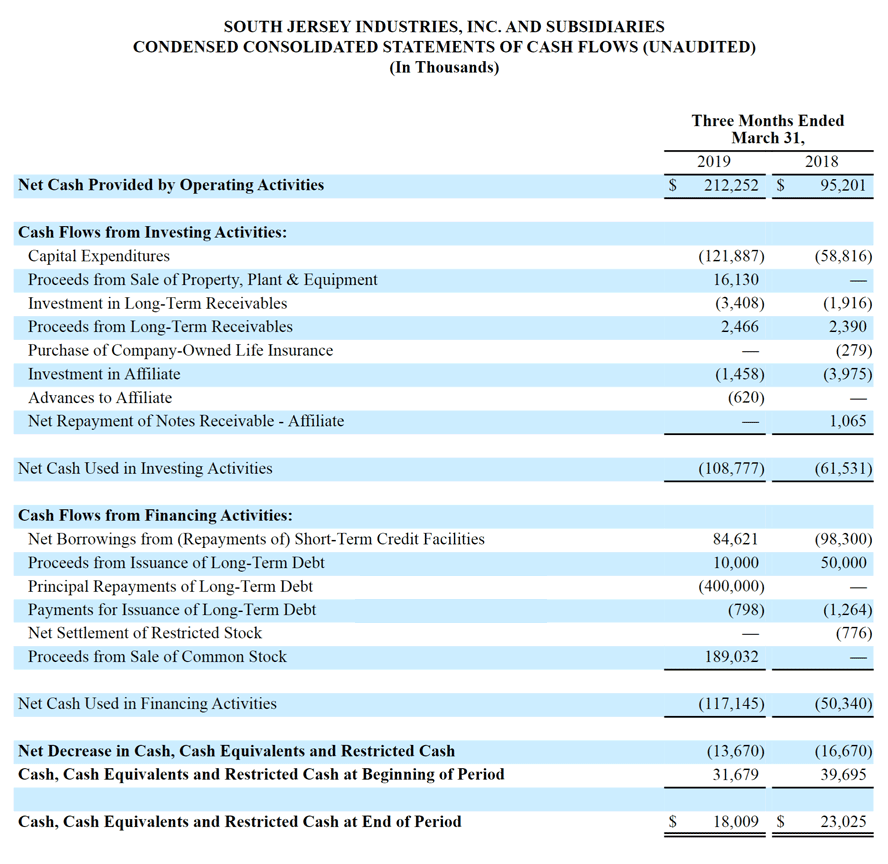
For the three months ended March 31, 2019, net cash from operating activities was $212.3 million compared to $95.2 million in the prior year period, primarily reflecting the addition of ETG and ELK. Net cash used in investing activities was $108.8 million compared with $61.5 million in the prior year period, reflecting our acquisition of ETG and ELK, timing of utility infrastructure upgrades, and investment to support customer growth. Net cash provided by financing activities was $117.1 million compared to $50.3 million in the prior year period, reflecting acquisitionrelated equity financing partially offset by debt repayments.
As of March 31, 2019, SJI had total borrowing facilities of $860.0 million, with $366.5 million drawn and $493.5 million in available liquidity.
Financial Guidance
2019 Guidance
SJI reaffirms it expects 2019 economic earnings in the range of $98 million to $107 million, or $1.05 to $1.15 per diluted share.
Economic earnings guidance primarily reflects 1) regulated operations that represent 80-85% of economic earnings excluding acquisition-related interest costs, 2) costs associated with the transition services agreement we have with Southern which we intend to exit by early 2020, 3) financing and operational requirements associated with our ETG/ELK acquisitions and divestitures of non-core nonregulated businesses and 4) timing associated with the execution and implementation of our regulatory strategy.
Capital expenditures are expected to be approximately $530 million in 2019. Investments in our regulated businesses are expected to represent more than 97 percent of capital expenditures. Following our equity forward draw in January, SJI does not anticipate any additional equity issuances in 2019.
2020 Guidance
SJI expects 2020 economic earnings in the range of $147 million to $160 million, or $1.53 to $1.67 per diluted share.
Economic earnings guidance primarily reflects 1) regulated operations that represent approximately 80% of earnings excluding acquisition-related interest costs, 2) accelerated utility customer growth and infrastructure replacement at both ETG and SJG, 3) execution of our regulatory strategy including base utility investment, 4) increased contribution from fuel management and a reshaped wholesale portfolio, and 5) lower operating costs driven by our business transformation activities.
Capital expenditures are expected to be approximately $565 million in 2020. Investments in our regulated businesses are again expected to represent more than 97 percent of capital expenditures, with an equity issuance planned to support a utility redundancy project.
Long-Term Guidance
SJI reaffirms it expects economic earnings per share to increase by an average of 6 to 8 percent annually between 2018 and 2022; however, the timing and frequency of regulatory filings will impact the growth rate in any individual year. Our financial guidance is also subject to the risks and uncertainties identified below under “Forward-Looking Statements and Risk Factors.”
Conference Call and Webcast
SJI will host a conference call and webcast on Thursday, May 9 to discuss our first quarter 2019 financial results. To access the call, please dial the applicable number approximately 5-10 minutes prior to the start time. The call will also be webcast in a listen-only format for the media and general public. The webcast can be accessed at www.sjindustries.com under Events & Presentations.
Date/Time: Thursday, May 9, 11:00 a.m. ET
Dial-In: Toll Free: 877-376-9937; Toll: 629-228-0738
Passcode: 1051217
About SJI
SJI (NYSE: SJI), an energy services holding company based in Folsom, NJ, delivers energy services to its customers through three primary subsidiaries. SJI Utilities, SJI’s regulated natural gas utility business, delivers safe, reliable, affordable natural gas to more than 690,000 South Jersey Gas, Elizabethtown Gas and Elkton Gas customers in New Jersey and Maryland. SJI’s non-utility businesses within South Jersey Energy Solutions promote efficiency, clean technology and renewable energy by providing customized wholesale commodity marketing and fuel management services; and developing, owning and operating on-site energy production facilities. SJI Midstream houses the company’s interest in the PennEast Pipeline Project. Visit sjindustries.com for more information about SJI and its subsidiaries.
Forward Looking Statements and Risk Factors
This news release, including information incorporated by reference, contains forward-looking statements within the meaning of the U.S. Private Securities Litigation Reform Act of 1995. All statements other than statements of historical fact, including statements regarding guidance, industry prospects or future results of operations or financial position, expected sources of incremental margin, strategy, financing needs, future capital expenditures and the outcome or effect of ongoing litigation, are forward-looking. This Quarterly Report uses words such as "anticipate," "believe," "expect," "estimate," "forecast," "goal," "intend," "objective," "plan," "project," "seek," "strategy," "target," "will" and similar expressions to identify forward-looking statements. These forward-looking statements are based on the beliefs and assumptions of management at the time that these statements were prepared and are inherently uncertain. Forward-looking statements are subject to risks and uncertainties that could cause actual results to differ materially from those expressed or implied in the forward-looking statements. These risks and uncertainties include, but are not limited to, general economic conditions on an international, national, state and local level; weather conditions in SJI’s marketing areas; changes in commodity costs; changes in the availability of natural gas; “nonroutine” or “extraordinary” disruptions in SJI’s distribution system; regulatory, legislative and court decisions; competition; the availability and cost of capital; costs and effects of legal proceedings and environmental liabilities; the failure of customers, suppliers or business partners to fulfill their contractual obligations; and changes in business strategies. These risks and uncertainties, as well as other risks and uncertainties that could cause our actual results to differ materially from those expressed in the forward-looking statements, are described in greater detail under the heading “Item 1A. Risk Factors” in SJI’s and SJG's Annual Report on Form 10-K for the year ended December 31, 2018 and in any other SEC filings made by SJI or SJG during 2018 and prior to the filing of this earnings release. No assurance can be given that any goal or plan set forth in any forward-looking statement can or will be achieved, and readers are cautioned not to place undue reliance on such statements, which speak only as of the date they are made. SJI and SJG undertake no obligation to revise or update any forward-looking statements, whether as result of new information, future events or otherwise, except as required by law.
Explanation of Non-GAAP Financial Measures
Management uses the non-generally accepted accounting principles (non-GAAP) financial measures of Economic Earnings and Economic Earnings per share when evaluating its results of operations. These non-GAAP financial measures should not be considered as an alternative to GAAP measures, such as net income, operating income, earnings per share from continuing operations or any other GAAP measure of liquidity or financial performance.
We define Economic Earnings as: Income from continuing operations, (i) less the change in unrealized gains and plus the change in unrealized losses on all derivative transactions; (ii) less realized gains and plus realized losses on all commodity derivative transactions attributed to expected purchases of gas in storage to match the recognition of these gains and losses with the recognition of the related cost of the gas in storage in the period of withdrawal; and (iii) less the impact of transactions, contractual arrangements or other events where management believes period to period comparisons of SJI's operations could be difficult or potentially confusing. With respect to part (iii) of the definition of Economic Earnings, for the three months March 31, 2019 and 2018, Economic Earnings excludes the following:
For the three months ended March 31, 2019, Economic Earnings excludes costs incurred to reorganize and restructure the business, including severance and other employee separation costs.
For the three months ended March 31, 2019 and 2018, Economic Earnings excludes costs to acquire the assets of ETG and ELK, including legal, consulting and other professional fees, and costs incurred to exit the Transaction Service Agreement (TSA). Economic Earnings also excludes costs incurred, partially offset by gains recognized, on the sale of the remaining solar assets.
For the three months ended March 31, 2019 and 2018, Economic Earnings excludes the impact of a May 2017 jury verdict stemming from a pricing dispute with a gas supplier over costs, including interest charges and legal fees incurred, along with the realized difference in the market value of the commodity (including financial hedges).
Economic Earnings is a significant performance metric used by our management to indicate the amount and timing of income from continuing operations that we expect to earn after taking into account the impact of derivative instruments on the related transactions, as well as the impact of contractual arrangements and other events that management believes make period to period comparisons of SJI's operations difficult or potentially confusing. Management uses Economic Earnings to manage its business and to determine such items as incentive/compensation arrangements and allocation of resources. Specifically regarding derivatives, we believe that this financial measure indicates to investors the profitability of the entire derivative-related transaction and not just the portion that is subject to mark-to-market valuation under GAAP. We believe that considering only the change in market value on the derivative side of the transaction can produce a false sense as to the ultimate profitability of the total transaction as no change in value is reflected for the non-derivative portion of the transaction.
Reconciliation of Non-GAAP Financial Measures
The following table presents a reconciliation of our income from continuing operations and earnings per share from continuing operations to Economic Earnings and Economic Earnings per share (in thousands, except per share data):
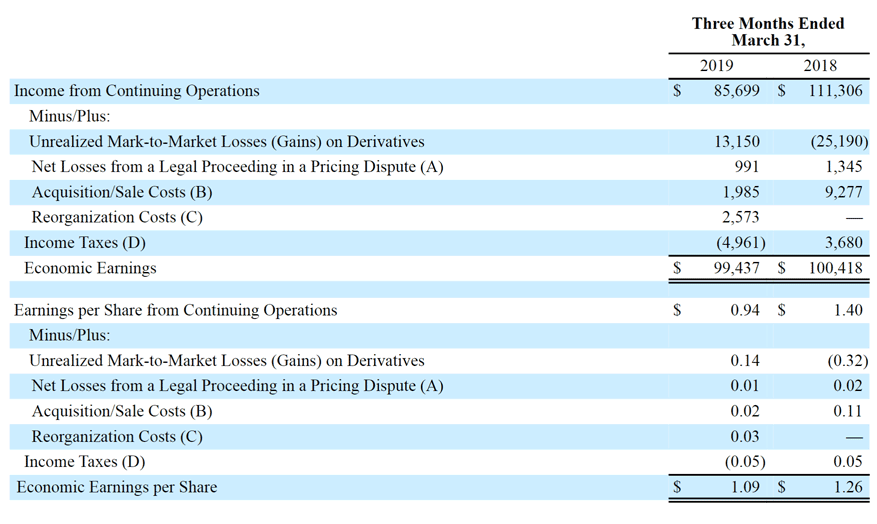
(A) Represents net losses, including interest, legal fees, and the realized difference in the market value of the commodity (including financial hedges), resulting from a ruling in a legal proceeding related to a pricing dispute between SJI and a gas supplier that began in October 2014.
(B) Represents costs incurred to acquire the assets of ETG and ELK, including legal, consulting and other professional fees, and costs incurred to exit the TSA. Also included here are costs incurred, partially offset by gains recognized, on the sale of the remaining solar assets.
(C) Represents costs incurred to reorganize and restructure the business, including severance and other employee separation costs. (D) Determined using a combined average statutory tax rate of approximately 26.5% and 25% for the three months ended March 31, 2019 and 2018, respectively.
Summary of Utility Margin
The following tables summarize Utility Margin for the three months ended March 31 2019 and 2018 for SJG, three months ended March 31 2019 for ETG (in thousands):
SJG:
ETG: