SJI Reports Second Quarter 2021 Results Reaffirms Guidance
Newsroom >
South Jersey Industries News
FOLSOM, NJ (August 4, 2021) - SJI (NYSE: SJI) today reported operating results for the second quarter and year-to-date (YTD) periods ended June 30, 2021. Highlights include:
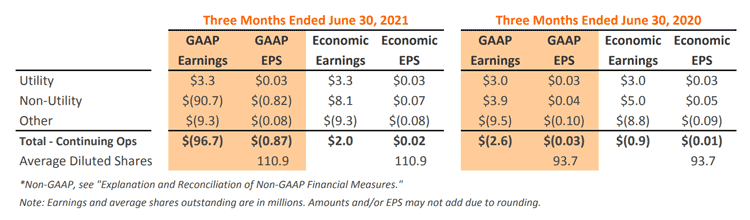
- Q2 2021 GAAP earnings $(0.87) per diluted share compared to $(0.03) per diluted share in 2020; Economic Earnings* $0.02 per diluted share compared to $(0.01) per diluted share in 2020
- YTD 2021 GAAP earnings $0.30 per diluted share compared to $1.06 per diluted share in 2020; Economic Earnings $1.22 per diluted share compared to $1.14 per diluted share in 2020
- Q2 2021/YTD GAAP earnings include an impairment charge for PennEast Pipeline project (see pg. 4 for details)
- Q2 2021/YTD economic earnings reflect increased profitability from Utility and Non-Utility operations partially offset by impact of financing activities
- SJG Infrastructure Investment Program (IIP) proposal progressing at New Jersey Board of Public Utilities (BPU)
- Renewable/Decarbonization investments proceeding on track — Bronx Fuel Cell project largely satisfies ITC goals for 2021; RNG development at 8 dairy farms progressing for in-service in 2022
- Reaffirming 2021 economic earnings guidance of $1.55-$1.65 per diluted share and capex of $740-$780M
"Our utility and non-utility businesses performed very well in the first half of the year and we remain on track to achieve our financial goals for 2021," said Mike Renna, SJI President and Chief Executive Officer. "We remain committed to delivering safe, reliable, affordable clean energy to our more than 700,000 customers and achieving our sustainability goals through critical and substantial energy infrastructure investments. My thanks, as always, to our entire team for their continued dedication to our mission and the ongoing successful achievement of our strategic goals," added Renna.
Second Quarter 2021 Results
For the three-month period ended June 30, 2021, SJI reported consolidated GAAP earnings of $(96.7) million compared to $(2.6) million in the prior year period. SJI uses the non-GAAP measure of economic earnings when discussing results. We believe this presentation provides clarity into the continuing earnings of our business. A full explanation and reconciliation of economic earnings is provided under “Explanation and Reconciliation of Non-GAAP Financial Measures” later in this report and in our 10-K for the year ending December 31, 2020. For the three-month period ended June 30, 2021, economic earnings were $2.0 million compared to $(0.9) million in the prior year period.
UTILITY
Utility entities include South Jersey Gas (SJG) and Elizabethtown Gas (ETG) operations. Second quarter 2021 GAAP/economic earnings were $3.3 million compared with $3.0 million in 2020.
South Jersey Gas
Performance. Second quarter 2021 GAAP/economic earnings were $6.3 million compared with $3.7 million in 2020. Utility margin increased $10.1 million, reflecting rate relief effective October 1, 2020, customer growth and the roll-in of investments from infrastructure replacement programs. We define utility margin, a non-GAAP measure, as natural gas revenues plus depreciation and amortization expenses, less natural gas costs, regulatory rider expenses and related volumetric and revenue-based energy taxes. Total expenses increased $7.5 million, primarily reflecting higher interest and depreciation expenses.
Customer Growth. SJG added approximately 7,300 new customers over the last 12 months and now serves approximately 408,000 customers. SJG’s 1.5% customer growth rate compares favorably to the peer average and remains driven by gas conversions from alternate fuels such as oil and propane, and new construction.
Infrastructure Modernization. Through infrastructure replacement programs, SJG enhances the safety and reliability of our system while earning our authorized utility return on approved investments in a timely manner.
- SJG's Accelerated Infrastructure Replacement Program (AIRP) authorizes investment of $302.5 million from 2016-2021 for important infrastructure replacement upgrades. Our annual investment of approximately $60 million from July 2020 to June 2021 is expected to be rolled into rates on October 1, 2021. SJG's Storm Hardening and Reliability Program (SHARP) authorizes investment of $100 million from 2018-2021 for four projects to enhance the safety, redundancy and resiliency of the distribution system along our coastal communities. Our annual investment of approximately $30 million from July 2020 to June 2021 is expected to be rolled into rates on October 1, 2021.
- In November 2020, SJG filed a request with the NJBPU for approval of an Infrastructure Investment Program (IIP) that would accelerate planned capital expenditures to enhance the delivery of safe, reliable, affordable natural gas, create jobs, and support the State’s environmental goals. Under the proposed five-year program, beginning in June 2021, SJG will invest approximately $742.5 million to replace 825 miles of aging steel mains and install excess flow valves on new service lines. These enhancements ensure the continued safety and reliability of SJG's system. Settlement discussions are progressing toward a final resolution.
Energy Efficiency. Through energy efficiency programs, SJG advances New Jersey’s clean energy goals in a manner that will benefit customers, the environment and the State’s green economy while recovering our investments in a timely manner. SJG's energy efficiency program, as approved by the BPU in April 2021, authorizes investment of $133.2 million from July 1, 2021 to June 30, 2024. Our anticipated annual investment of approximately $45 million from July 2021 to June 2022 is expected to be recovered beginning in October 2022.
Redundancy. SJG has submitted an engineering and route proposal to the BPU for approval to construct needed system upgrades in support of a planned 2.0+ Bcf liquefied natural gas (LNG) facility. Discussions with the BPU surrounding this important project continue to progress, with resolution expected before year end. We also continue to explore system alternatives that will allow for a secondary supply of gas needed to create reliability and resiliency for approximately 140,000 customers in Atlantic and Cape May counties.
Elizabethtown Gas
Performance. Second quarter 2021 GAAP/economic earnings were $(3.0) million compared with $(0.8) million in 2020. Utility margin, as previously defined, remained consistent compared to the year ago period, primarily reflecting customer growth and the roll-in of investments from infrastructure replacement programs that was offset by true-ups for sales tax and regulatory programs. Total expenses increased $2.2 million, primarily reflecting higher operating and depreciation expenses.
Customer Growth. ETG added approximately 4,100 new customers over the last 12 months and now serves approximately 303,000 customers. ETG’s 1.3% customer growth rate has increased from its historic 0.9% rate, driven by increases in gas conversions from alternate fuels such as oil and propane, and new construction.
Infrastructure Modernization. ETG's Infrastructure Investment Plan (IIP) authorizes investment of $300 million from 2019-2024 for important infrastructure upgrades including the replacement of up to 250 miles of cast iron and bare steel mains. Our annual investment of approximately $60 million from July 2020 to June 2021 is expected to be rolled into rates on October 1, 2021.
Energy Efficiency. ETG's energy efficiency program, as approved by the BPU in April 2021, authorizes investment of $74.0 million from July 1, 2021 to June 30, 2024. Our anticipated annual investment of approximately $25 million from July 2021 to June 2022 is expected to be recovered beginning in October 2022.
NON-UTILITY
Non-utility entities include Energy Management, Energy Production and Midstream. Second quarter 2021 GAAP earnings were $(90.7) million compared with $3.9 million in 2020. Second quarter 2021 economic earnings were $8.1 million compared with $5.0 million in 2020.
Energy Management
Performance. Energy Management includes Wholesale Services (Fuel Management/Marketing) and Retail Services (Account Services/Energy Consulting). Second quarter 2021 GAAP earnings were $(4.1) million compared with $5.4 million in 2020. Second quarter 2021 economic earnings were $7.0 million compared with $6.3 million in 2020.
- Wholesale Services/Other second quarter 2021 GAAP earnings were $(4.7) million compared with $4.8 million in 2020. Second quarter 2021 economic earnings were $6.3 million compared with $5.8 million in 2020, primarily reflecting improved asset optimization opportunities, as well as fuel management contracts that became operational over the last 12 months.
- Retail Services second quarter 2021 GAAP earnings were $0.6 million compared with $0.6 million in 2020. Second quarter 2021 economic earnings were $0.7 million compared with $0.5 million in 2020, reflecting meter reading and appliance service contract fees, as well as contributions from Energy Consulting activities.
Energy Production
Performance. Energy Production primarily includes renewable (fuel cell/solar) and decarbonization (REV/RNG development) investments. Second quarter 2021 GAAP earnings were $(0.4) million compared with $(2.4) million in 2020. Second quarter 2021 economic earnings were $(0.2) million compared with $(2.2) million in 2020.
- Renewables second quarter 2021 GAAP earnings were $(0.2) million compared with $(2.4) million in 2020. Second quarter 2021 economic earnings were $0.1 million compared with $(2.2) million in 2020, reflecting income associated with fuel cell and solar investments over the last twelve months, and landfill activities.
- In June, Catamaran Renewables, a JV between SJI subsidiary Marina Energy and renewable industry leader Captona, announced the acquisition of a 5.0 MW fuel cell project in Bronx, New York ("Bronx Midco"). Similar to the two fuel cells in Staten Island brought online in 2020, this investment qualifies under New York’s Value of Distributed Energy Resources (VDER) program. With roughly 75% of fuel cell revenues fixed under VDER and an anticipated 95% availability rate, these projects produce steady, low-risk cash flows and unlevered returns in line with our hurdle rate for non-utility investments. Marina will own 92% of the project and accordingly, receive 92% of the ITC, cash flows and net income associated with the project. The project is supported by long-term off-take agreements with two creditworthy anchor customers. This project will support a substantial portion of SJI's 2021 ITC goals.
- In December 2020, SJI acquired a minority interest in REV LNG, LLC (REV), along with the rights to develop anaerobic digesters at a portfolio of dairy farms to produce renewable natural gas. Decarbonization second quarter 2021 GAAP/economic earnings were $(0.2) million, reflecting contributions from SJI's minority interest in REV offset by initial operating costs. RNG development at 8 diary farms is proceeding on track, with in-service anticipated in 2022.
Midstream
Performance. Midstream includes SJI's 20% equity interest in the PennEast Pipeline. Second quarter 2021 GAAP earnings were $(86.1) million compared with $0.9 million in 2020. Second quarter 2021 economic earnings were $1.2 million compared with $0.9 million in 2020, reflecting Allowance for Funds Used During Construction related to the project.
Update. Work continues with state and federal agencies to obtain the required permits to begin construction of the PennEast Pipeline. Despite the favorable outcome from the Supreme Court, PennEast continues to experience regulatory and legal challenges resulting in continued delays preventing the commencement of construction and commercial operation of the project. As a result, the Company evaluated its investment in PennEast and recorded an other-than-temporary impairment charge of $87.4 million in the condensed consolidated statements of income for the three and six months ended June 30, 2021. This action does not change our belief that PennEast is an important and needed project to serve constrained markets in the region, and that it should be built. Natural gas continues to play a critical role in meeting the energy needs of the United States, and the northeast in particular, and will be critical to ensure that energy remains affordable and reliable as we transition our supplies to lower-carbon sources.
OTHER
Performance. Other entity includes interest on debt, including debt associated with past acquisitions. Second quarter 2021 GAAP earnings were $(9.3) million compared with $(9.5) million in 2020. Second quarter 2021 economic earnings were $(9.3) million compared with $(8.8) million in 2020, reflecting an increase in outstanding debt partially offset by debt repayments and refinancing.
Six Months 2021 Results
For the six-month year-to-date (YTD) period ended June 30, 2021, SJI reported consolidated GAAP earnings of $32.1 million compared to $98.5 million in the prior year period.
For the six-month period YTD period ended June 30, 2021, economic earnings were $130.9 million compared to $106.0 million in the prior year period.
UTILITY
2021 YTD GAAP earnings were $124.9 million compared with $110.7 million in 2020. 2021 YTD economic earnings were $124.9 million compared with $111.9 million in 2020.
- SJG. 2021 YTD GAAP earnings were $89.9 million compared with $74.2 million in 2020. 2021 YTD economic earnings were $89.9 million compared with $75.4 million in 2020. Utility margin increased $26.8 million, primarily reflecting rate relief effective October 1, 2020, customer growth and the roll-in of investments from infrastructure replacement programs. Total expenses increased $12.3 million, primarily reflecting higher interest and depreciation expenses.
- ETG. 2021 YTD GAAP/economic earnings were $35.0 million compared with $35.9 million in 2020. Utility margin increased $4.2 million, primarily reflecting customer growth and the roll-in of investments from infrastructure replacement programs. Total expenses increased $5.1 million, primarily reflecting higher operating and depreciation expenses.
NON-UTILITY
2021 YTD GAAP earnings were $(74.4) million compared with $9.7 million in 2020. 2021 YTD economic earnings were $24.1 million compared with $11.3 million in 2020.
- Energy Management. 2021 YTD GAAP earnings were $9.6 million compared with $11.0 million in 2020. 2021 YTD economic earnings were $20.9 million compared with $12.2 million in 2020.
- Wholesale Services/Other 2021 YTD GAAP earnings were $8.3 million compared with $10.3 million in 2020. 2021 YTD economic earnings were $19.6 million compared with $11.2 million in 2020, primarily reflecting improved asset optimization opportunities.
- Retail Services 2021 YTD GAAP earnings were $1.3 million compared with $0.7 million in 2020. 2021 YTD economic earnings were $1.3 million compared with $1.0 million in 2020, reflecting meter reading and appliance service contract fees and contributions from Energy Consulting activities.
- Energy Production. 2021 YTD GAAP earnings were $1.2 million compared with $(3.4) million in 2020. 2021 YTD economic earnings were $1.0 million compared with $(2.9) million in 2020.
- Renewables 2021 YTD GAAP earnings were $0.9 million compared with $(3.4) million in 2020. 2021 YTD economic earnings were $0.6 million compared with $(2.9) million in 2020, primarily reflecting income associated with fuel cell and solar investments over the last twelve months.
- Decarbonization 2021 YTD earnings were $0.3 million, reflecting SJI's minority interest in REV.
- Midstream. 2021 YTD GAAP earnings were $(85.1) million compared with $2.1 million in 2020, reflecting the PennEast impairment charge discussed on page 4. 2021 YTD economic earnings were $2.2 million compared with $2.1 million in 2020, reflecting Allowance for Funds Used During Construction related to the project.
OTHER
2021 YTD GAAP earnings were $(18.4) million compared with $(21.9) million in 2020, reflecting the aforementioned impairment. 2021 YTD economic earnings were $(18.2) million compared with $(17.3) million in 2020, reflecting an increase in outstanding debt partially offset by debt repayments and refinancing.
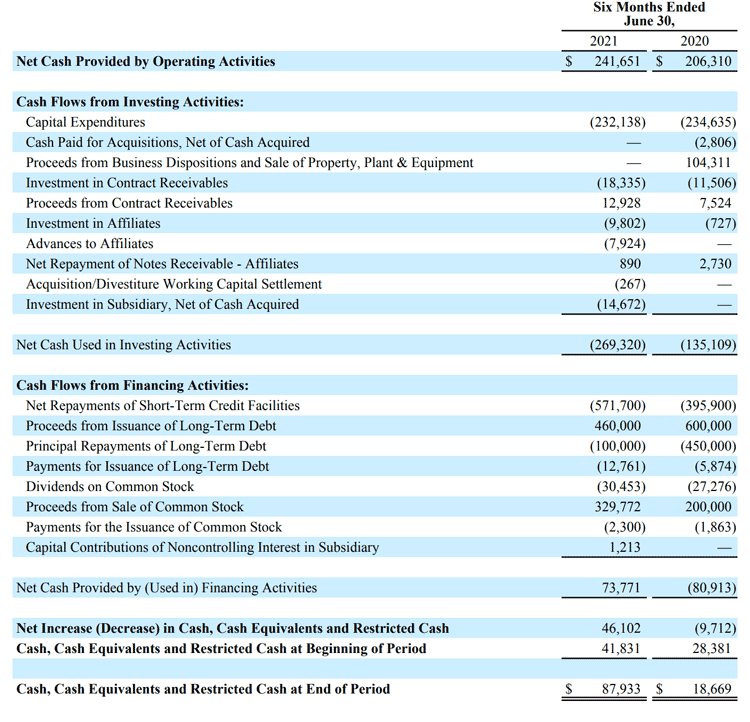
Capital Expenditures and Cash Flow
For the six months ended June 30, 2021:
- Net cash provided by operating activities was $241.7 million compared with $206.3 million in the prior year period, primarily reflecting rate relief at SJG, improved wholesale marketing results and customer growth.
- Net cash used in investing activities was $269.3 million compared with $135.1 million in the prior year period, primarily reflecting $232.1 million in capital expenditures for utility infrastructure modernization and $31.5 million in affiliate and clean energy investments.
- Net cash provided by (used in) financing activities was $73.8 million compared with $(80.9) million in the prior year period, primarily reflecting debt and equity issuances offset by debt repayment and refinancing.
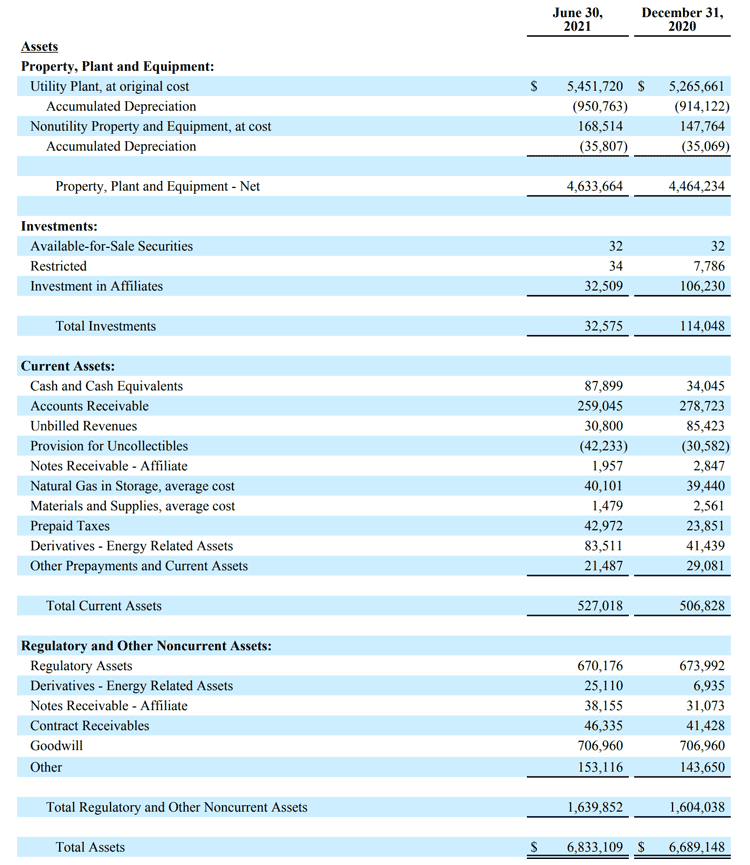
Balance Sheet
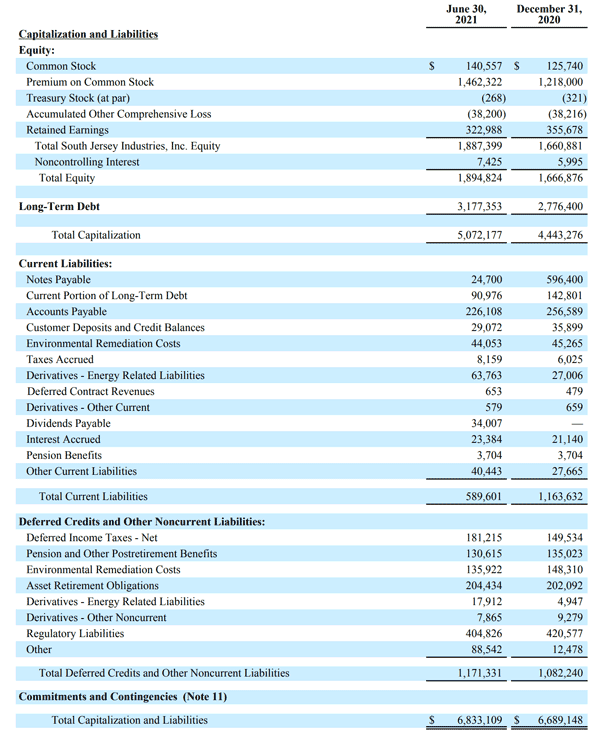
- Equity-to-total capitalization was 36.5% at June 30, 2021 compared with 32.2% at December 31, 2020, largely reflecting equity financing and repayment of debt.
- Assuming conversion of mandatory convertible equity units and equity credit from rating agencies for long-duration debt, SJI's adjusted equity-to-total capitalization, a non-GAAP measure, was 44.9% at June 30, 2021 compared with 39.7% at December 31, 2020.
- As of June 30, 2021, SJI had total credit facilities of $910 million, with $873.4 million of available liquidity.
Dividends
On August 4, SJI’s board of directors declared its regular dividend of $0.3025 per share for the third quarter of 2021. The dividend is payable October 4, 2021 to shareholders of record at the close of business on September 10, 2021. This is SJI's 70th consecutive year of paying dividends, reflecting the company's commitment to a consistent, sustainable dividend.
Guidance and Outlook
Based on solid operational performance through the first half of the year, we are reaffirming our expectation for 2021 economic earnings of $1.55 to $1.65 per diluted share.
Our long-term economic earnings per share growth target remains 5 to 8 percent, with significant step ups in 2023 and 2025, driven by timing associated with utility rate cases and clean energy investments. Our long-term targets are based on expected annual rate base growth of approximately 10 percent, driven by above average customer growth, a long runway for infrastructure modernization, and clean energy and decarbonization investment.
We affirm our five-year capital expenditures outlook through 2025 of approximately $3.5 billion and our expected 2021 investment of $740 to 780 million, with $490 to 510 million for Utility investment and $250 to $270 million for Non-Utility investment primarily focused on decarbonization and renewables.
Conference Call & Webcast
SJI will host a conference call and webcast on Thursday, August 5 to discuss second quarter 2021 financial results. To access the call, please dial the applicable number approximately 5-10 minutes prior to the start time. The call will also be webcast in a listen-only format for the media and general public. The webcast can be accessed at www.sjindustries.com under Events & Presentations.
Date/Time:
Thursday, August 5, 11:00 a.m. ET
Dial-In:
Toll Free: 866-652-5200; Toll: 412-317-6060
About SJI
SJI (NYSE: SJI), an energy services holding company based in Folsom, NJ, delivers energy services to its customers through three primary subsidiaries. SJI Utilities, SJI’s regulated natural gas utility business, delivers safe, reliable, affordable natural gas to approximately 700,000 South Jersey Gas and Elizabethtown Gas customers in New Jersey. SJI’s non-utility businesses within South Jersey Energy Solutions promote efficiency, clean technology and renewable energy by providing customized wholesale commodity marketing and fuel management services; and developing, owning and operating on-site energy production facilities. SJI Midstream houses the company’s interest in the PennEast Pipeline Project. Visit sjindustries.com for more information about SJI and its subsidiaries.
Forward-Looking Statements and Risk Factors
This news release, including information incorporated by reference, contains forward-looking statements within the meaning of the U.S. Private Securities Litigation Reform Act of 1995. All statements other than statements of historical fact, including statements regarding guidance, industry prospects or future results of operations or financial position, expected sources of incremental margin, strategy, financing needs, future capital expenditures and the outcome or effect of ongoing litigation, are forward-looking. This Quarterly Report uses words such as "anticipate," "believe," "expect," "estimate," "forecast," "goal," "intend," "objective," "plan," "project," "seek," "strategy," "target," "will" and similar expressions to identify forward-looking statements. These forward-looking statements are based on the beliefs and assumptions of management at the time that these statements were prepared and are inherently uncertain. Forward-looking statements are subject to risks and uncertainties that could cause actual results to differ materially from those expressed or implied in the forward-looking statements. These risks and uncertainties include, but are not limited to, general economic conditions on an international, national, state and local level; weather conditions in SJI’s marketing areas; changes in commodity costs; changes in the availability of natural gas; “non-routine” or “extraordinary” disruptions in SJI’s distribution system; cybersecurity incidents and related disruptions; regulatory, legislative and court decisions; competition; the availability and cost of capital; costs and effects of legal proceedings and environmental liabilities; the failure of customers, suppliers or business partners to fulfill their contractual obligations; changes in business strategies; and public health crises and epidemics or pandemics, such as a novel coronavirus (COVID-19). These risks and uncertainties, as well as other risks and uncertainties that could cause our actual results to differ materially from those expressed in the forward-looking statements, are described in greater detail under the heading “Item 1A. Risk Factors” in this Quarterly Report, SJI’s and SJG's Annual Report on Form 10-K for the year ended December 31, 2020 and in any other SEC filings made by SJI or SJG during 2020 and 2021 and prior to the filing of this earnings release. Also refer to the additional risk factor described below:
Explanation of Non-GAAP Financial Measures
Management uses the non-GAAP financial measures of Economic Earnings and Economic Earnings per share when evaluating its results of operations. These non-GAAP financial measures should not be considered as an alternative to GAAP measures, such as net income, operating income, earnings per share from continuing operations or any other GAAP measure of financial performance. We define Economic Earnings as: Income from Continuing Operations, (i) less the change in unrealized gains and plus the change in unrealized losses on non-utility derivative transactions; (ii) less income and plus losses attributable to noncontrolling interest; and (iii) less the impact of transactions, contractual arrangements or other events where management believes period to period comparisons of SJI's operations could be difficult or potentially confusing. With respect to part (iii) of the definition of Economic Earnings, items excluded from Economic Earnings for the three and six months ended June 30, 2021 and 2020, are described in (A)-(E) in the table below. Economic Earnings is a significant financial measure used by our management to indicate the amount and timing of income from continuing operations that we expect to earn after taking into account the impact of derivative instruments on the related transactions, as well as the impact of contractual arrangements and other events that management believes make period to period comparisons of SJI's operations difficult or potentially confusing. Management uses Economic Earnings to manage its business and to determine such items as incentive/compensation arrangements and allocation of resources. Specifically regarding derivatives, we believe that this financial measure indicates to investors the profitability of the entire derivative-related transaction and not just the portion that is subject to mark-to-market valuation under GAAP. We believe that considering only the change in market value on the derivative side of the transaction can produce a false sense as to the ultimate profitability of the total transaction as no change in value is reflected for the non-derivative portion of the transaction.
Reconciliation of Non-GAAP Financial Measures
The following table presents a reconciliation of our income from continuing operations and earnings per share from continuing operations to Economic Earnings and Economic Earnings per share (in thousands, except per share data):
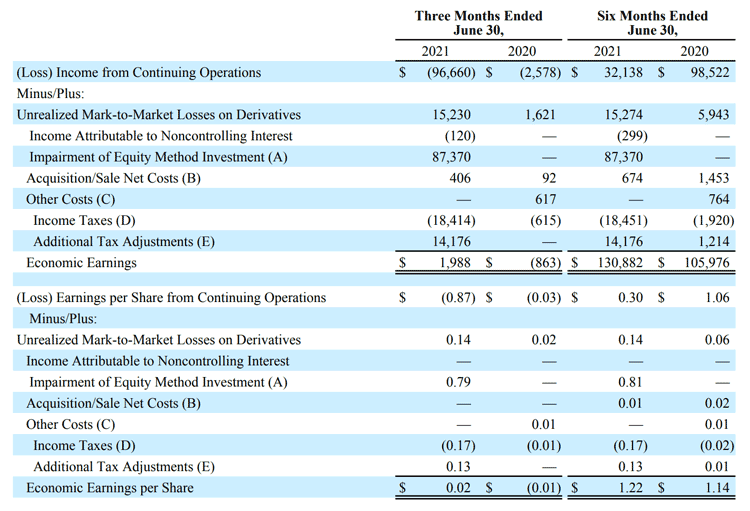
(A) Represents an other-than-temporary impairment charge on the Company’s equity method investment in PennEast.
(B) Represents costs incurred in 2021 to finalize the transactions related to Bronx Midco, along with the final working capital payment on the sale of ELK, which was finalized during the first quarter of 2021. Also represents items recognized during the three and six months ended June 30, 2020 such as costs incurred to prepare to exit the TSA, and gains/losses recognized and costs incurred on the sale of solar assets as well as MTF/ACB.
(C) Represents severance and other employee separation costs, along with costs incurred to cease operations at three landfill gas-to-energy production facilities.
(D) The income taxes were determined using a combined average statutory tax rate.
(E) Represents additional tax adjustments, primarily including a federal deferred tax asset valuation allowance at SJI related to the impairment charge described in (A), and a one-time tax adjustment in 2020 resulting from the BPU's approval of a stipulation for SJG.
Summary of Utility Margin
The following tables summarize Utility Margin for the three months ended March 31, 2021 and 2020 for SJG and ETG (in thousands):
SJG:
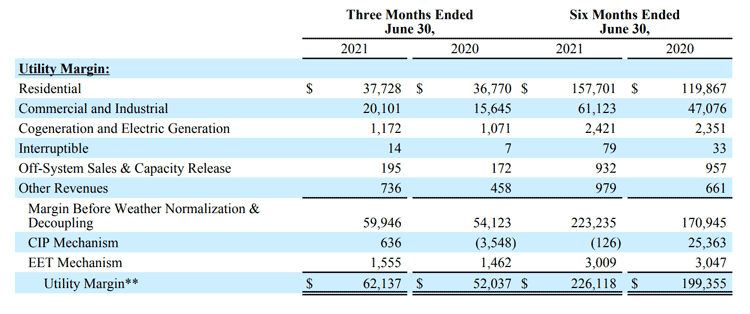
ETG:
*Represents pass-through expenses for which there is a corresponding credit in operating revenues. Therefore, such recoveries have no impact on financial results.
**Utility Margin is a non-GAAP financial measure and is further defined on page 2 under SJG performance. The definition of Utility Margin is the same for SJG and ETG gas utility operations.
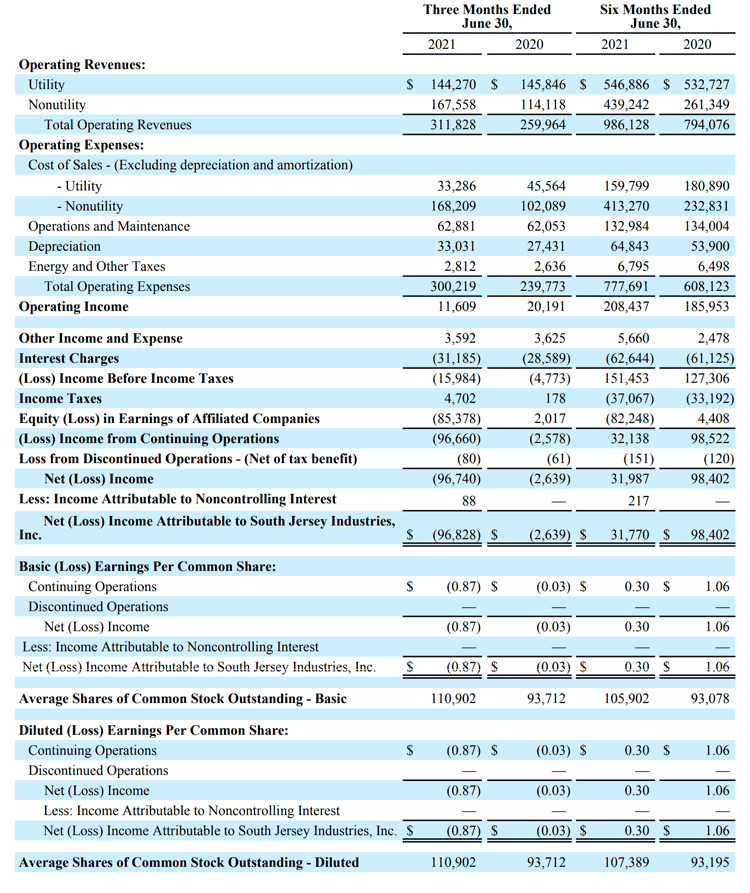
SOUTH JERSEY INDUSTRIES, INC. AND SUBSIDIARIES
CONDENSED CONSOLIDATED STATEMENTS OF (LOSS)/INCOME (UNAUDITED)
(In Thousands Except for Per Share Data)
SOUTH JERSEY INDUSTRIES, INC. AND SUBSIDIARIES
CONDENSED CONSOLIDATED STATEMENTS OF CASH FLOWS (UNAUDITED)
(In Thousands)
 SOUTH JERSEY INDUSTRIES, INC. AND SUBSIDIARIES
CONDENSED CONSOLIDATED BALANCE SHEETS (UNAUDITED)
(In Thousands)
SOUTH JERSEY INDUSTRIES, INC. AND SUBSIDIARIES
CONDENSED CONSOLIDATED BALANCE SHEETS (UNAUDITED)
(In Thousands)