SJI Reports Third Quarter Results; Reaffirms Guidance
Newsroom >
South Jersey Industries News
FOLSOM, NJ (November 7, 2018) – SJI (NYSE: SJI) today reported operating results for its 2018 third quarter and nine months year-to-date (YTD) periods ended September 30, 2018. Highlights include:
- Third quarter 2018 GAAP loss per diluted share of $0.53 compared to loss of $0.47 last year
- Third quarter 2018 Economic Earnings* loss per diluted share of $0.27 compared to loss of $0.05 last year
- On October 22, announced strategy targeting economic EPS growth of 6-8% annually driven by significant $2.5B+ investment in regulated business modernization and expansion
- On October 29, ETG filed proposal with NJBPU seeking authorization for $518M, five-year infrastructure replacement program designed to enhance the safety and reliability of the ETG system
- Reaffirming 2018 economic earnings guidance of $1.57 to $1.65 per diluted share, excluding impacts of acquisitions and divestitures, and $1.35-$1.40 per diluted share including these items
“Our third quarter results were in line with our expectations and we remain on track to deliver solid economic EPS in 2018,” said Michael Renna, SJI Chief Executive Officer. “The success of our business transformation efforts over several years, including the acquisitions of ETG and ELK and ongoing separation of non-core, non-regulated businesses, have positioned us for top-tier, highly-visible, regulated-driven economic EPS growth of 6-8% annually well into the next decade,” Renna added.


Third Quarter 2018 Results
For the three months ended September 30, 2018, SJI reported a loss in consolidated GAAP earnings of $45.6M ($0.53 per share) compared to a loss of $37.5M ($0.47 per share) in the prior year period.
SJI uses the non-GAAP measure of Economic Earnings when discussing results. We believe this presentation provides clarity into the continuing earnings of our business. A full explanation and reconciliation of economic earnings is provided under “Explanation and Reconciliation of Non-GAAP Financial Measures” later in this report and in our 10-Q for the period ending September 30, 2018.
Economic earnings for third quarter 2018 were a loss of $23.2M ($0.27 per share) compared to a loss of $4.0M ($0.05 per share) last year. Third quarter 2018 economic earnings include the impacts of acquisitions and divestitures of a $14.4M loss ($0.16 per share).
SJI Utilities (SJIU)
The SJI Utilities segment includes the gas distribution operations of South Jersey Gas (SJG), Elizabethtown Gas (ETG) and Elkton Gas (ELK). As a reminder, utility operations typically report a loss during the third quarter owing to seasonality. Given partial year contributions from ETG and ELK, third quarter earnings performance relative to the year ago period is not comparable.
Third quarter 2018 GAAP earnings were a loss of $27.1M ($0.32 per share). GAAP earnings include $15.3M in customer bill credits ($11.1M after-tax) for ETG and ELK consistent with acquisition approval.
Third quarter 2018 economic earnings were a loss of $16.1M ($0.19 per share).
Both GAAP and economic earnings for third quarter 2018 reflect the addition of Elizabethtown Gas and Elkton Gas operating activities which reduced earnings by $7.1M ($0.08 per share).
South Jersey Gas
Operating Performance. GAAP earnings and economic earnings are the same for SJG. Third quarter 2018 earnings were a loss of $9.0M ($0.11 per share) compared with a loss of $5.8M ($0.07 per share) in the prior year. The $3.2M quarterly decline reflects higher operating costs partially offset by higher utility margin.
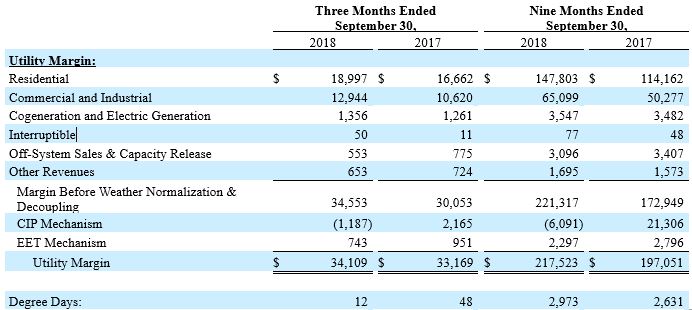
Utility margin increased ~$1.0M million compared with last year. We define utility margin, a non-GAAP measure, as natural gas revenues less natural gas costs, regulatory rider expenses and related volumetric and revenue-based energy taxes. Margin improvement was driven by customer growth, our base rate case settlement, and the roll-in of investments from AIRP and SHARP infrastructure replacement programs. Gains were partially offset by a reduction in customer billings as a result of the Tax Cuts and Jobs Act and the operation of our Conservation Incentive Program (CIP) mechanism which adjusts earnings for customer usage variances. The CIP reduced third quarter 2018 utility margin $1.2M compared with a $2.2M increase in third quarter 2017 utility margin.
Utility operating costs increased ~$4.2M compared with last year, excluding expenses for clean energy, energy efficiency and environmental remediation programs that are offset by an equal amount in revenues. Higher costs reflect a combination of higher depreciation, interest and operation and maintenance expenses primarily aimed at improving efficiency and productivity for the benefit of our customers. Higher depreciation reflects capital investment in infrastructure and customer growth.
Customer Growth. SJG added ~6,900 net customers over the last 12 months and now serves more than 387K customers. SJG’s 1.8% growth rate compares favorably to our peers and remains driven by gas conversions (~75% of new customer additions) from alternate fuels such as oil and propane. SJG is on track to add more than 7K net customers in 2018.
Infrastructure Modernization. Through infrastructure replacement programs, SJI is able to enhance the safety and reliability of our system while earning our authorized utility return on approved investments in a timely manner.
- Our current Accelerated Infrastructure Replacement Program (AIRP) authorizes investment of $302.5M from 2016-2021 for important infrastructure replacement upgrades. We expect to have replaced all bare steel and cast-iron mains within SJG’s service territory by the end of the current program. We are on track with our targeted investment of ~$60M annually under this program. Our most recent annual investment of $60.4M for the period July 2017 to June 2018 was rolled into SJG rates effective October 1.
- Our current Storm Hardening and Reliability Program (SHARP) was approved in May and authorizes investment of $100M from 2018-2021 for four projects to enhance the safety, redundancy and resiliency of the distribution system along our coastal communities.
Elizabethtown Gas
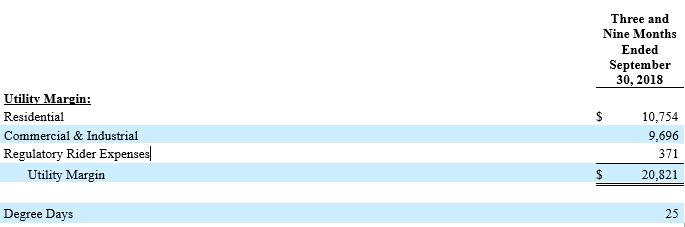
Operating Performance. GAAP earnings and economic earnings are typically the same for ETG. However, third quarter 2018 GAAP loss of $17.8M ($0.21 per share) includes a non-recurring $15M customer bill credit ($10.8M after-tax) consistent with acquisition approval. Utility margin of $20.8M was driven by customer growth and revenue from the 2017 base rate case offset by costs associated with the planned exit of the company’s current transition service agreement with Southern Company (SO) and interest expense.
Customer Growth. ETG added ~2,300 net customers over the last 12 months and now serves more than 291K customers. ETG’s 0.8% growth rate has historically been driven by a balanced mix of new construction and gas conversions from alternate fuels such as oil and propane. ETG is on track to add ~3K net customers in 2018. In future years, we expect an increased rate of growth driven by an enhanced focus on conversion opportunities.
Infrastructure Modernization. Consistent with acquisition approval, SJI was required to develop a plan, in concert with the Staff of the New Jersey Board of Public Utilities (NJBPU), to address remaining aging infrastructure at ETG.
On October 29, ETG filed a $518M, five-year infrastructure replacement program proposal with the NJBPU. The design of ETG’s Infrastructure Investment Plan (IIP) includes a request for timely recovery of our investment on a semi-annual basis through a separate Rider recovery mechanism.
The IIP proposes the retirement of 364 miles of vintage main including cast-iron, unprotected and bare steel, ductile iron, copper and vintage plastic main; installation of 309 miles of polyethylene plastic; 41K new services; 38K excess flow valves; and moving 44K inside meters to the outside with house regulators. The proposal also seeks to convert five remaining master-metered apartment complexes within ETG’s service area to individually-metered units. New main, service lines and ~1,300 individual meters would be installed as part of the program. A final decision from the NJBPU is anticipated in 2019.
Elkton Gas
GAAP earnings and economic earnings are typically the same for ELK. However, third quarter 2018 GAAP loss of $0.4M ($0.00 per share) includes a non-recurring $0.3M customer bill credit consistent with acquisition approval. Utility margin from customer growth and infrastructure investment was offset by operating costs and interest expense.
In June, ELK filed a base rate case application with the Maryland Public Service Commission (MPSC). In September, ELK revised its application to request an annual revenue increase of $0.3M based on an 11.5% ROE and 44.8% equity component. A final decision from the MPSC is anticipated in 2019.
Midstream
Midstream is primarily comprised of our 20% equity investment in the PennEast Pipeline (PennEast). PennEast is a planned $1B+, 1 Bcf, 120-mile interstate pipeline running from the Marcellus region of Pennsylvania into New Jersey.
GAAP income from continuing operations and economic earnings are the same for Midstream. Third quarter 2018 earnings were $0.8M ($0.01 per share) compared with $1.3M ($0.02 per share) in the prior year, reflecting Allowance for Funds Used During Construction (AFUDC) related to the project.
We continue to work with our PennEast partners as this critical infrastructure project moves through the state permitting process. We are working through the details of gaining access to all land parcels along the route in order to submit final detailed surveys for permits. PennEast expects to begin construction on the project in late 2019.
Energy Group
The Energy Group segment includes our non-regulated operations engaged in fuel supply management services, wholesale gas marketing, and retail gas and electric marketing.
Third quarter 2018 GAAP earnings were a loss of $7.8M ($0.09 per share) compared with a loss of $7.4M ($0.09 per share) in the prior year. Third quarter 2018 economic earnings were $1.9M ($0.02 per share) compared with a loss of $0.8M ($0.01 per share) in the prior year.
- Fuel management activities contributed economic earnings of $2.0M compared with $1.4M the prior year driven by a larger portfolio of contracts (seven) compared with last year (five). We expect two additional facilities to begin operations in the fourth quarter, providing low-risk earnings growth.
- Wholesale marketing contributed economic earnings of $0.3M compared with a loss of $1.5M last year, driven by higher margins on daily energy trading activities. As of September 30, 2018, wholesale energy operations held 8.6 Bcf of storage and 0.56 Bcf/d of transportation under contract compared with 7.3 Bcf of storage and 0.42 Bcf/d in the prior year.
- Retail marketing and Other contributed a loss in economic earnings of $0.4M compared with a loss in economic earnings of $0.8M last year. As previously communicated, we no longer view retail marketing as core to our growth strategy and we are evaluating options to optimize the value of this business.
Energy Services
The Energy Services segment consists of our non-regulated energy production portfolio including solar, combined heat and power (CHP) and landfill gas-to-electric assets, as well as our account services business.
Third quarter 2018 GAAP results were $0.0M ($0.00 per share) compared with a loss of $25.7M ($0.33 per share) in the prior year, driven by the absence of a solar impairment charge recorded in 2017. Third quarter 2018 economic earnings were a loss of $1.1M ($0.01 per share) compared with $1.3M ($0.02 per share) the prior year.
- Contributions from energy production contributed a loss in economic earnings of $1.8M compared with $1.6M last year primarily due to our June 2018 agreement to sell our solar assets.
- Account Services contributed economic earnings of $0.7M compared with a loss of $0.3M last year, partially mitigating energy production results.
Recall in June 2018, SJI entered into an agreement to sell our portfolio of solar energy projects to an entity managed by Goldman Sachs Asset Management (GSAM) for approximately $350M in cash. SJI has received $180.3M of the purchase price as of October 31, with the balance to be received over the next several months as individual projects in the portfolio satisfy closing conditions. SJI continues to expect nearly all projects in the portfolio will satisfy their closing conditions prior to December 31, 2018.
As previously communicated, we no longer view energy production as core to our growth strategy and we are evaluating options to optimize the value of our remaining businesses.
Year-to-Date Results

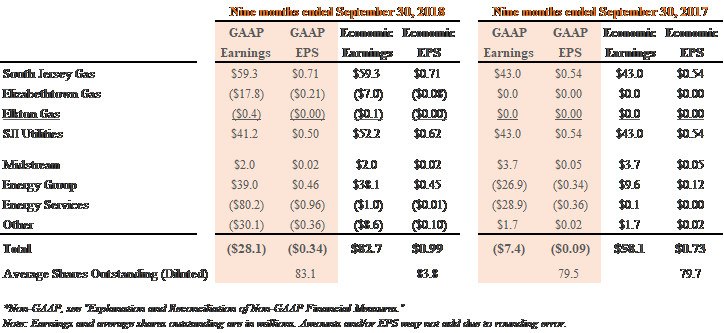
For the nine months year-to-date (YTD) period ended September 30, 2018, SJI reported a loss in consolidated GAAP earnings of $28.1M ($0.34 per share) compared to a loss of $7.4M ($0.09 per share) in the prior year period.
2018 YTD economic earnings were $82.7M ($0.99 per share) compared to $58.1M ($0.73 per share) last year. 2018 YTD economic earnings include the impacts of acquisitions and divestitures of a $14.4M loss ($0.16 per share).
SJI Utilities (SJIU)
2018 YTD GAAP earnings were $41.2M ($0.50 per share). GAAP earnings include $15.3M in customer bill credits ($11.1M after-tax) for ETG and ELK, consistent with acquisition approval. 2018 economic earnings were $52.2M ($0.62 per share). Both 2018 GAAP and economic earnings YTD reflect the addition of Elizabethtown Gas and Elkton Gas operating activities which reduced earnings by $7.1M ($0.08 per share). As a reminder, given partial year contributions from ETG and ELK, YTD earnings performance relative to the year ago period is not comparable.
South Jersey Gas
2018 earnings YTD were $59.3M ($0.71 per share) compared with $43.0M ($0.54 per share) in the prior year. Improved results primarily reflect increased utility margin offset in part by increased operating costs, driven by the same factors as the third quarter.
Elizabethtown Gas / Elkton Gas
We completed the acquisitions of ETG and ELK on July 1, 2018. As a result, 2018 earnings YTD for these operations are equivalent to third quarter GAAP and economic earnings results.
Midstream
2018 earnings YTD were $2.0M ($0.02 per share) compared to $3.7M ($0.05 per share) in the prior year. Higher results for the year ago period reflected a catch-up of AFUDC related to prior periods that had not been deemed appropriate to record until original receipt of FERC approval.
Energy Group
2018 GAAP earnings YTD were $39.0M ($0.46 per share) compared with a loss of $26.9M ($0.34 per share) in the prior year. 2018 economic earnings YTD were $38.1M ($0.45 per share) compared with $9.6M ($0.12 per share) in the prior year primarily reflecting strong performance from our wholesale business.
- Fuel management contributed 2018 economic earnings YTD of $6.2M compared with $4.1M the prior year driven by a larger portfolio of contracts (seven) compared with last year (five). We are now serving seven facilities with two more expected to begin operation in the fourth quarter.
- Wholesale marketing contributed 2018 economic earnings YTD of $32.9M compared to $5.1M the prior year, driven by portfolio optimization and higher spreads experienced this past winter 2017/2018 as compared to the winter of 2016/2017, and the impact of federal tax reform.
- Retail marketing and Other contributed 2018 economic earnings loss YTD of $1.0M compared with economic earnings of $0.4M last year, reflecting competitive pressures in this business.
Energy Services
2018 GAAP earnings YTD were a loss of $80.2M ($0.96 per share) compared with a loss of $28.9M ($0.36 per share) in the prior year, driven by impairments associated with the sale of our solar assets. 2018 economic earnings YTD were a loss of $1.0M ($0.01 per share) compared with $0.1M ($0.00 per share) the prior year, driven by the same factors as the third quarter.
Balance Sheet and Cash Flow
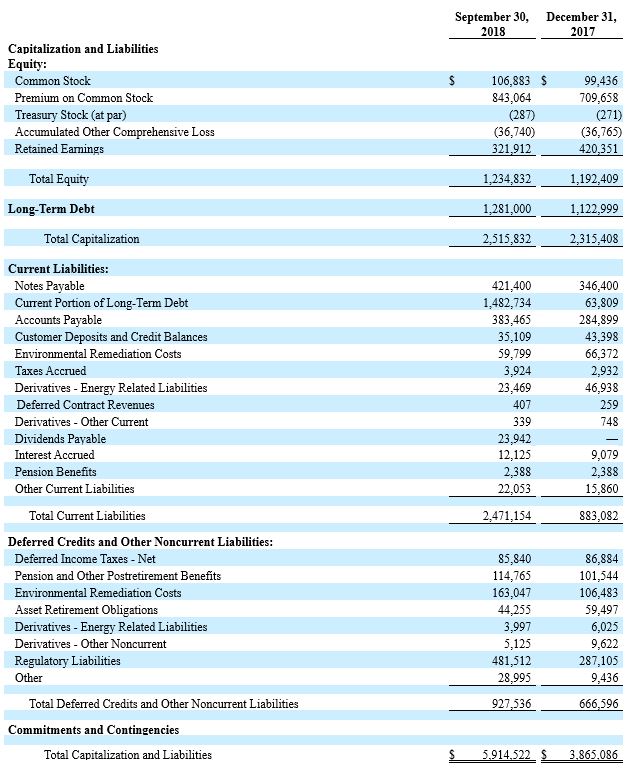
SJI remains committed to a strong capital structure with ample liquidity and a solid investment grade rating. At September 30, 2018, equity-to-total capitalization was 27.9% compared with 43.7% at December 31, 2017, reflecting acquisition-related financing activity. As previously communicated at our Investor Conference, we anticipate full draw of our equity forward (~$200M) and use of proceeds from the sale of our solar portfolio (~$350M) and any other non-core asset sale for repayment of debt. Our plan also embeds conversion of our mandatory convertible equity units due 2021 ($279M). We are committed to a capital structure that allows for $2.5B+ in regulated-driven capital spending under our five-year plan while maintaining an equity-to-total capitalization of 35-40%.
For the nine months ended September 30, 2018, net cash from operating activities was $173.4M compared to $127.1M in the prior year period, primarily reflecting strong operating performance at Energy Group earlier in the year. Net cash used in investing activities was $1.96B compared with $229.4M in the prior year period, reflecting our acquisition of ETG and ELK, timing of utility infrastructure upgrades, and investment to support customer growth. Net cash provided by financing activities was $1.76B compared to $89.8M in the prior year period, primarily reflecting acquisition-related debt and equity financing.
Dividends
On July 5, the SJI board of directors declared a quarterly common stock dividend of $0.28 per share that was payable October 2, 2018, to shareholders of record on September 10, 2018. SJI has continuously paid a cash dividend since 1950 and has increased the dividend each year since 1999. Our targeted payout is 55-65% of economic earnings.
Earnings Guidance
We are reaffirming 2018 economic earnings per share guidance of $1.57 to $1.65 excluding impacts of acquisitions and divestitures, and $1.35-$1.40 per share including these items. This range reflects strong results from South Jersey Gas, wholesale marketing and fuel management activities partially offset by results from energy services, as well as the mid-year timing of our acquisitions and financing of ETG and ELK and sale of our solar assets. We are also reaffirming our expectation for long-term economic EPS growth of 6-8% annually. Our guidance is subject to the risks and uncertainties identified below under “Forward-Looking Statements.”
Conference Call and Webcast
SJI will host a conference call and webcast on Thursday, November 8 to discuss its third quarter 2018 financial results. To access the call, please dial the applicable number approximately 5-10 minutes prior to the start time.
Date/Time:
Thursday, November 8, 11:00 a.m. ET
Dial-In:
Toll Free: 877-376-9937; Toll: 1-629-228-0738
Passcode:
4099554
The call will also be webcast in a listen-only format for the media and general public. The webcast can be accessed at www.sjindustries.com under Events & Presentations. A replay of the webcast will be available on our website at www.sjindustries.com under Event & Presentations.
About SJI
SJI (NYSE: SJI), an energy services holding company based in Folsom, NJ, delivers safe, reliable, affordable natural gas service to more than 680,000 customers in New Jersey and Maryland through its three regulated natural gas utilities: South Jersey Gas, Elizabethtown Gas and Elkton Gas. SJI’s non-utility businesses within South Jersey Energy Solutions promote efficiency, clean technology and renewable energy by providing customized wholesale commodity marketing and fuel management services; acquiring and marketing natural gas and electricity for retail customers; and owning and operating on-site energy production facilities. SJI Midstream houses the company’s interest in the PennEast Pipeline Project. Visit
http://www.sjindustries.com for more information about SJI and its subsidiaries.
Forward Looking Statements and Risk Factors
This news release, including information incorporated by reference, contains forward-looking statements within the meaning of the U.S. Private Securities Litigation Reform Act of 1995. All statements other than statements of historical fact, including statements regarding guidance, industry prospects or future results of operations or financial position, expected sources of incremental margin, strategy, financing needs, future capital expenditures and the outcome or effect of ongoing litigation, are forward-looking. This Quarterly Report uses words such as "anticipate," "believe," "expect," "estimate," "forecast," "goal," "intend," "objective," "plan," "project," "seek," "strategy," "target," "will" and similar expressions to identify forward-looking statements. These forward-looking statements are based on the beliefs and assumptions of management at the time that these statements were prepared and are inherently uncertain. Forward-looking statements are subject to risks and uncertainties that could cause actual results to differ materially from those expressed or implied in the forward-looking statements. These risks and uncertainties include, but are not limited to, general economic conditions on an international, national, state and local level; weather conditions in SJI’s marketing areas; changes in commodity costs; changes in the availability of natural gas; “non-routine” or “extraordinary” disruptions in SJI’s distribution system; regulatory, legislative and court decisions; competition; the availability and cost of capital; costs and effects of legal proceedings and environmental liabilities; the failure of customers, suppliers or business partners to fulfill their contractual obligations; and changes in business strategies. These risks and uncertainties, as well as other risks and uncertainties that could cause our actual results to differ materially from those expressed in the forward-looking statements, are described in greater detail under the heading “Item 1A. Risk Factors” in SJI’s and SJG's Annual Report on Form 10-K for the year ended December 31, 2017 and in any other SEC filings made by SJI or SJG during 2018 and prior to the filing of this earnings release. No assurance can be given that any goal or plan set forth in any forward-looking statement can or will be achieved, and readers are cautioned not to place undue reliance on such statements, which speak only as of the date they are made. SJI and SJG undertake no obligation to revise or update any forward-looking statements, whether as result of new information, future events or otherwise, except as required by law.
Explanation of Non-GAAP Financial Measures
Management uses the non-generally accepted accounting principles (non-GAAP) financial measures of Economic Earnings and Economic Earnings per share when evaluating its results of operations. These non-GAAP financial measures should not be considered as an alternative to GAAP measures, such as net income, operating income, earnings per share from continuing operations or any other GAAP measure of liquidity or financial performance.
We define Economic Earnings as: Income from continuing operations, (i) less the change in unrealized gains and plus the change in unrealized losses on all derivative transactions; (ii) less realized gains and plus realized losses on all commodity derivative transactions attributed to expected purchases of gas in storage to match the recognition of these gains and losses with the recognition of the related cost of the gas in storage in the period of withdrawal; (iii) less the impact of transactions or contractual arrangements where the true economic impact will be realized in a future period, along with other events that management believes make period to period comparisons of SJI's operations difficult or potentially confusing. With respect to part (iii) of the definition of Economic Earnings, for the three and nine months ended September 30, 2018 and 2017, Economic Earnings excludes the following:
- For the nine months ended September 30, 2018, Economic Earnings excludes approximately $99.2 million (pre-tax) of impairment charges recorded on solar generating facilities, which was primarily driven by the purchase price in the agreement to sell solar assets being less than the carrying amount of the assets.
- For the three and nine months ended September 30, 2018, Economic Earnings excludes $2.9 million and $38.4 million (pre-tax), respectively, of various costs related to the Acquisition as well as to a series of agreements whereby Marina will sell its portfolio of solar energy assets to a third-party buyer.
- For the three and nine months ended September 30, 2018, Economic Earnings excludes approximately $15.3 million (pre-tax) of credits to ETG and ELK customers.
- For the three and nine months ended September 30, 2018 and 2017, Economic Earnings excludes the impact of a May 2017 jury verdict stemming from a pricing dispute with a gas supplier over costs, including interest charges and legal fees incurred, along with the realized difference in the market value of the commodity (including financial hedges). Economic Earnings also excludes, for the three and nine months ended September 30, 2017, the impact of a 2017 settlement of a legal claim stemming from a dispute related to a three-year capacity management contract with a counterparty, including legal fees incurred.
- For the nine months ended September 30, 2017, Economic Earnings excludes an approximately $2.4 million pre-tax loss related to a new interest rate derivative and amendments made to an existing interest rate derivative linked to unrealized losses previously recorded in Accumulated Other Comprehensive Loss (AOCL). SJI reclassified this amount from AOCL to Interest Charges on the condensed consolidated statements of income as a result of the prior hedged transactions being deemed probable of not occurring. Since the economic impact will not be realized until future periods, this amount is excluded from Economic Earnings.
- For the three and nine months ended September 30, 2017, Economic Earnings excludes approximately $43.9 million and $44.2 million, respectively, of pre-tax charges related to impairment charges taken in the first and third quarters of 2017 on solar generating facilities, for which the economic impact will not be realized until a future period.
Economic Earnings is a significant performance metric used by our management to indicate the amount and timing of income from continuing operations that we expect to earn after taking into account the impact of derivative instruments on the related transactions, those transactions or contractual arrangements where the true economic impact will be realized primarily in a future period or was realized in a previous period, and other events that management believes make period to period comparisons of SJI's operations difficult or potentially confusing. Specifically regarding derivatives, we believe that this financial measure indicates to investors the profitability of the entire derivative-related transaction and not just the portion that is subject to mark-to-market valuation under GAAP. We believe that considering only the change in market value on the derivative side of the transaction can produce a false sense as to the ultimate profitability of the total transaction as no change in value is reflected for the non-derivative portion of the transaction.
Reconciliation of Non-GAAP Financial Measures
The following tables present a reconciliation of SJI's income from continuing operations and earnings per share from continuing operations to Economic Earnings and Economic Earnings per share for the three and nine months ended September 30 (in thousands, except per share data):
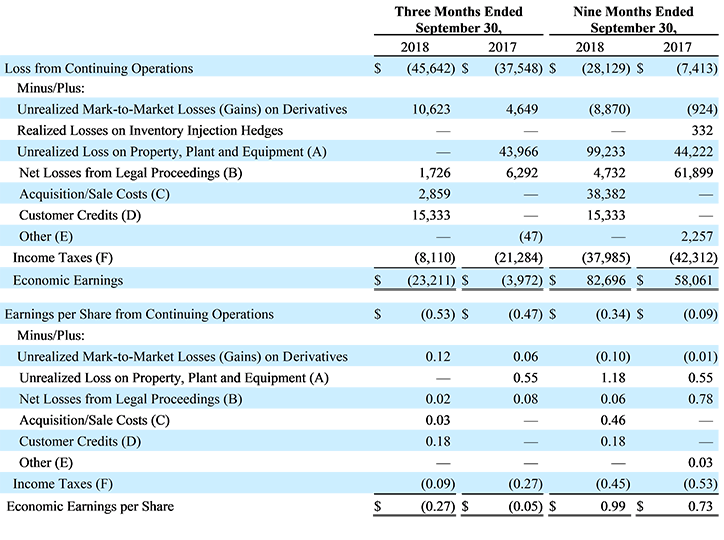

(A) Represents impairment charges taken on solar generating facilities in 2018, which was primarily driven by the purchase price in the agreement to sell solar assets being less than the carrying amount of the assets, and in 2017, which was primarily driven by declining market conditions at that time, specifically market prices of SRECs.
(B) Represents net losses from two separate legal proceedings: (a) charges, including interest, legal fees, and the realized difference in the market value of the commodity (including financial hedges), resulting from a ruling in a legal proceeding related to a pricing dispute between SJI and a gas supplier that began in October 2014; and (b) a charge in the nine months ended September 30, 2017, including legal fees, resulting from a settlement with a counterparty over a dispute related to a three-year capacity management contract. Since the net losses relate to purchase transactions that primarily occurred in prior periods, these amounts are excluded from Economic Earnings.
(C) Represents costs incurred in connection with the acquisition of the assets of Elizabethtown Gas and Elkton Gas. Also represents costs incurred to enter into series of agreements whereby Marina will sell its portfolio of solar energy assets to a third-party buyer.
(D) Represents credits to ETG and ELK customers.
(E) Included in this amount are amendments made to an existing interest rate derivative linked to unrealized losses previously recorded in AOCL. SJI reclassified this amount from AOCL to Interest Charges on the unaudited condensed consolidated statements of income as a result of the prior hedged transactions being deemed probable of not occurring. Since the economic impact will not be realized until future periods, this amount is excluded from Economic Earnings. Also included is additional depreciation expense within Economic Earnings on a solar generating facility where an impairment charge was recorded in the past, which reduced the depreciable basis and recurring depreciation expense, and the related reduction in depreciation expense was added back in the prior year.
(F) Determined using a combined average statutory tax rate of approximately 27% and 40% for 2018 and 2017, respectively.
Summary of Utility Margin
The following table summarizes Utility Margin for the three and nine months ended September 30 (in thousands):
South Jersey Gas:

Elizabethtown Gas:

CONDENSED CONSOLIDATED STATEMENTS OF INCOME (UNAUDITED)
(In Thousands Except for Per Share Data)

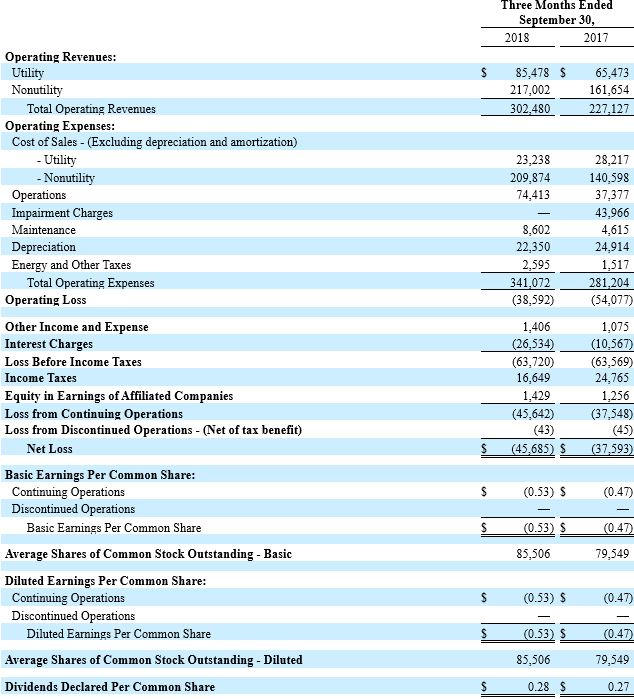
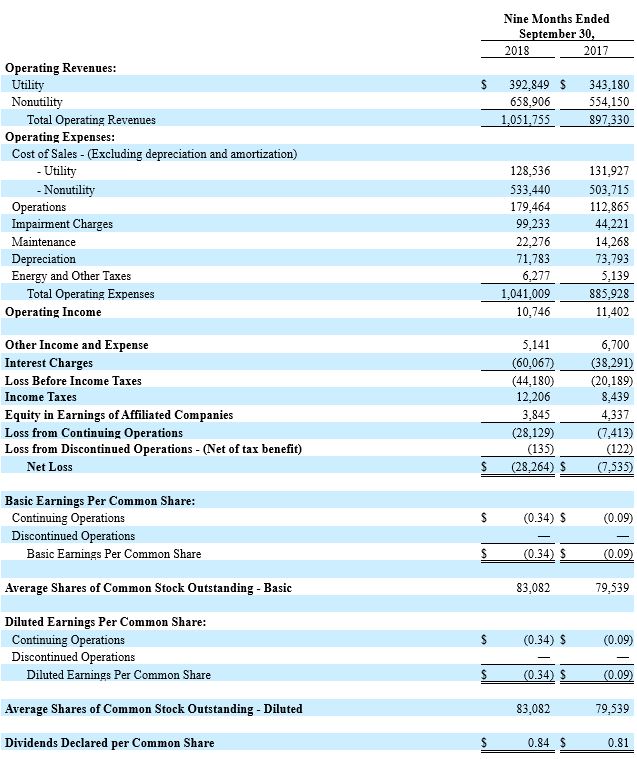
SOUTH JERSEY INDUSTRIES, INC. AND SUBSIDIARIES
CONDENSED CONSOLIDATED STATEMENTS OF CASH FLOWS (UNAUDITED)
(In Thousands)
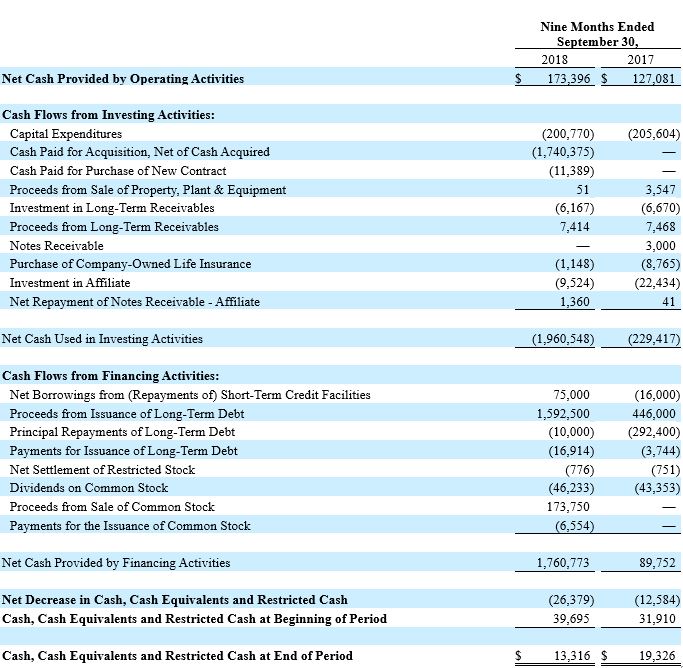

SOUTH JERSEY INDUSTRIES, INC. AND SUBSIDIARIES
CONDENSED CONSOLIDATED BALANCE SHEETS (UNAUDITED)
(In Thousands)

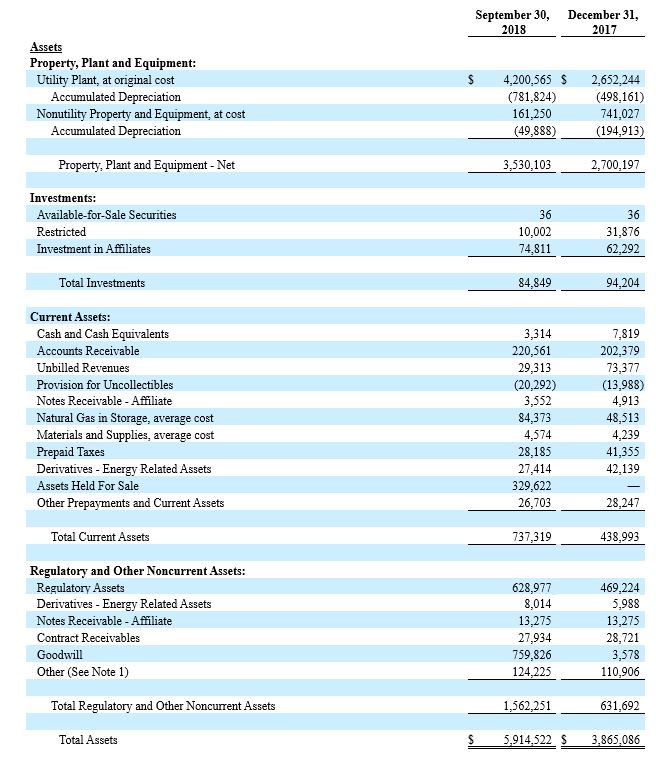
SOUTH JERSEY INDUSTRIES, INC. AND SUBSIDIARIES
CONDENSED CONSOLIDATED BALANCE SHEETS (UNAUDITED)
(In Thousands)