FOR IMMEDIATE RELEASE
South Jersey Industries Reports First Quarter Results
FOLSOM, NJ (May 7, 2018) – South Jersey Industries (NYSE: SJI) today reported operating results for its fiscal 2018 first quarter ended March 31, 2018. Highlights include:
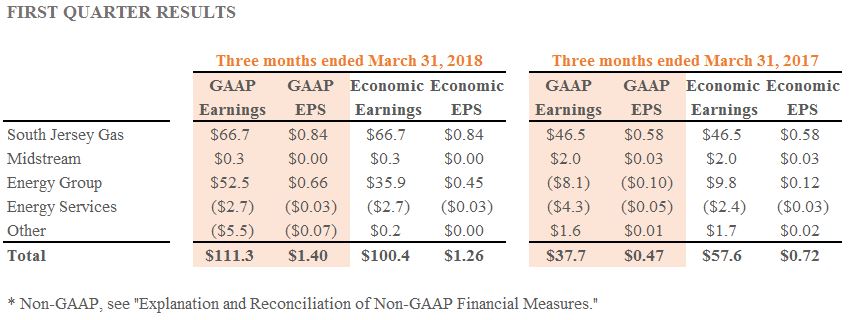
- GAAP earnings were $1.40 per diluted share compared to $0.47 per diluted share last year
- Economic Earnings* were $1.26 per diluted share compared to $0.72 per diluted share last year
- Strong quarterly gain reflects solid improvement in both our regulated and non-regulated operations
- Shift to more regulated business mix on track, with regulatory approvals and financing of Elizabethtown Gas (ETG) and Elkton Gas (Elkton) acquisitions proceeding well and ongoing review of our non-core, non-regulated businesses
- Reaffirming 2018 Economic Earnings guidance of $1.57 to $1.65 per diluted share
“We are off to a strong start in 2018,” said Michael Renna, president and chief executive officer of SJI. “Our regulated business benefited from our recent base rate case, customer growth and continued infrastructure investment intended to enhance and improve service and reliability to our customers. Our non-regulated operations, specifically our wholesale marketing and fuel management businesses, posted strong gains as well, capitalizing on favorable weather and tax reform.”
“We also made great strides in advancing our shift to a more regulated business mix, including the completion of a successful equity offering to help fund our acquisition of Elizabethtown and Elkton.” added Renna. “We are excited by our ongoing business transformation and remain confident in our ability to achieve our 2020 standalone economic earnings target of $160 million and post-acquisition EPS accretion beginning in 2020.”
First Quarter 2018 Results
Consolidated GAAP income from continuing operations for the three months ended March 31, 2018 was $111.3 million ($1.40 per diluted share) compared to $37.7 million ($0.47 per share) in the prior year period.
SJI uses the non-GAAP measure of Economic Earnings when discussing results. We believe this presentation provides clarity into the true continuing income of our business. A full explanation and reconciliation of economic earnings is provided under “Explanation and Reconciliation of Non-GAAP Financial Measures.”
Economic earnings for first quarter 2018 were $100.4 million ($1.26 per share), up from $57.6 million ($0.72 per share) last year, reflecting higher earnings at South Jersey Gas and Energy Group partially offset by lower earnings at Midstream and Energy Services. We review the performance of each segment below:
South Jersey Gas (SJG)
Our gas utility segment includes the regulated gas distribution operations of South Jersey Gas (SJG).
Operating Performance
GAAP income from continuing operations and economic earnings are the same for SJG. First quarter 2018 economic earnings were $66.7 million ($0.84 per share), up from $46.5 million ($0.58 per share) in the prior year. The improvement largely reflects an increase in utility margin partially offset by higher operating costs.
We define utility margin, a non-GAAP measure, as natural gas revenues less natural gas costs, regulatory rider expenses and related volumetric and revenue-based energy taxes. Utility margin increased to $134.0 million compared with $118.5 million in the prior year period. The $15.5 million increase was driven by our base rate case settlement ($22.8 million), the roll-in of investments for infrastructure replacement and improvement ($4.5 million) and customer growth ($1.0 million) partially offset by a deferral of excess taxes billed ($12.8 million) that will be returned to customers.
Utility operating costs were $50.6 million compared with $41.4 million a year ago. The $9.2 million increase largely reflects higher operating & maintenance expense ($7.5 million) tied to increases in personnel, governance, compliance and system maintenance. These investments are primarily aimed at improving efficiency and productivity for the benefit of our customers. Higher depreciation expense ($1.7 million) reflects capital investment in infrastructure and customer growth.
Customer Growth
South Jersey Gas added more than 8,800 new customers over the last 12 months and now serves more than 385,000 customers. Our 1.6% growth rate compares favorably to our peers and has largely been driven by gas conversions (~70% of new customer additions) from alternate fuels. We continue to estimate an additional 50,000 customers currently served by higher-priced alternate fuels are located very near our system, implying solid potential for conversion activity in the future.
Our proposed $115 million pipeline project to supply natural gas to the former BL England (BLE) generating facility remains in the legal appeal process. The pipeline is intended to boost reliability for gas customers in Cape May and Atlantic counties and provide gas for the power plant's conversion from coal and oil-fired electric generation. The project received Pinelands Commission approval in February 2017, but the approval process has been contested by environmental groups. We anticipate receiving a favorable resolution on BLE in 2018.
Regulatory Update
We remain committed to modernizing our distribution system for the benefit of customers. In November 2017, we filed for an extension of our Storm Hardening and Reliability Program (SHARP) with the New Jersey Board of Public Utilities (NJBPU). Our petition requests approval to invest $110 million from 2018-2021 on four specific projects to enhance the safety, redundancy and resiliency of our distribution system for coastal communities. A final order is expected in 2018.
Midstream
The Midstream segment includes our 20% equity investment in the PennEast Pipeline project (PennEast). PennEast is a planned $1B+, 1 Bcf, 120-mile interstate pipeline running from the Marcellus region of Pennsylvania into New Jersey.
GAAP income from continuing operations and economic earnings are the same for Midstream. First quarter 2018 economic earnings were $0.3 million ($0.00 per share), down from $2.0 million ($0.03 per share) in the prior year. Strong results in first quarter 2017 reflect a catch-up of Allowance for Funds Used During Construction (AFUDC) related to prior periods that had not been deemed appropriate to record until original receipt of Federal Energy Regulatory Commission (FERC) approval.
In January, PennEast received its Certificate of Public Convenience and Necessity from FERC. With this approval, we are moving to the next phase to obtain survey access and submit completed applications for water permits in New Jersey and with the Delaware River Basin Commission (DRBC). Construction is expected to begin upon receipt of approvals from these entities, with in-service expected in late 2019.
Energy Group
The Energy Group segment includes our non-regulated operations engaged in fuel supply management services and wholesale and retail gas and electric commodity marketing.
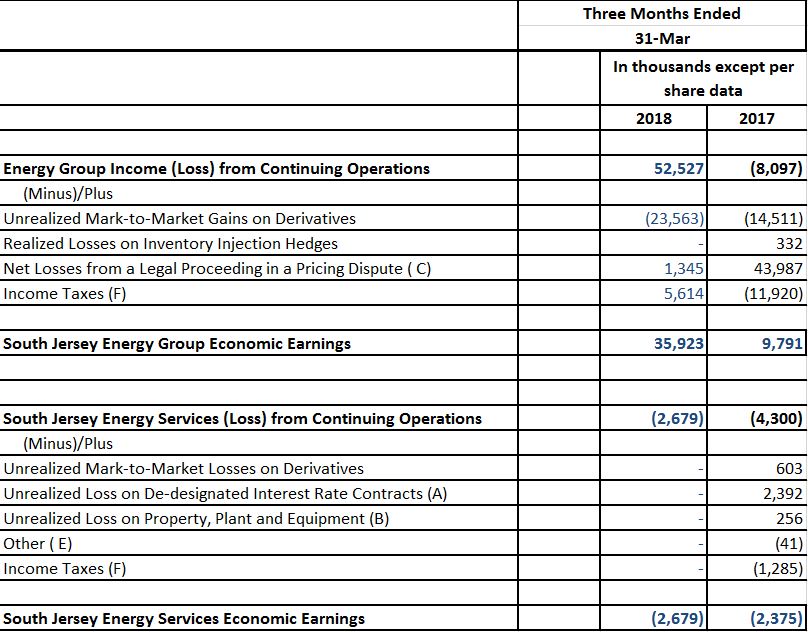
First quarter 2018 GAAP earnings were $52.5 million ($0.66 per share), up from a loss of $8.1 million ($0.10 per share) in the prior year. First quarter 2018 economic earnings were $35.9 million ($0.45 per share), up from $9.8 million ($0.12 per share) in the prior year.
First quarter 2018 economic earnings primarily reflect strong results from our wholesale business of $33.3 million ($0.42 per share) compared to $7.6 million ($0.09 per share) the prior year. This improvement primarily reflects portfolio optimization during cold weather in January compared with extremely warm weather in Q1’17, and the impact of federal tax reform.
Fuel management activities contributed economic earnings of $2.8 million ($0.03 per share) compared with $1.4 million ($0.02 per share) the prior year driven by a larger portfolio of contracts (six) compared with last year (five). We expect that an additional three fuel supply management contracts will come on-line in 2018 and two more by the end of 2020, providing low-risk segment growth.
Our retail gas and electric commodity marketing business generated a loss in economic earnings of $0.1 million ($0.00 per share), down compared with $0.6 million ($0.01 per share) last year, reflecting a continuation of increased competition and tighter margins in this business.
Energy Services
The Energy Services segment consists of our energy production portfolio including solar, combined heat and power (CHP) and landfill gas-to-electric assets. First quarter 2018 GAAP results were a loss of $2.7 million ($0.03 per share) compared with a loss of $4.3 million ($0.05 per share) in the prior year. First quarter 2018 economic earnings were a loss of $2.7 million ($0.03 per share) compared with a loss of $2.4 million ($0.03 per share) the prior year.
Economic earnings from our account services businesses, South Jersey Energy Service Plus and Millennium Account Services, were up $0.4 million compared with the prior year. The gain, however, was more than offset by a $0.7 million decline from combined heat and power (CHP), solar and landfill activities reflecting increased costs, higher interest expense and a one percent decline in solar production. Consistent with our strategic plan, there were no investment tax credits related to renewable project development in first quarter 2018 results or the year ago period.
Business Transformation
In 2015, we began a planned shift in our future operating strategy toward a more regulated business mix. Our plan was driven by a desire to increase the quality of our earnings by increasing investment in utility and FERC-regulated assets that provide highly-visible cash flows and earnings while at the same time reducing our earnings volatility and optimizing the value of our non-core, non-regulated businesses.
We have made significant progress toward implementing our plan since that time. In 2016, we announced a cessation of new investment in solar projects, reduced our portfolio of on-site energy production businesses, and significantly strengthened our balance sheet through a successful equity offering. In 2017, we announced plans to acquire ETG and Elkton, assets ideally tailored to our strategy (discussed below). In 2018, we completed a successful equity raise to finance the acquisitions (net proceeds totaling $447 million received to date, with $200 million to be received at SJI’s option in the future) and announced a strategic review of our remaining non-core, non-regulated businesses.
Acquisition Update
In October 2017, we announced plans to acquire neighboring gas utility ETG as well as Elkton from Southern Company (SO). The acquisition process is progressing and remains on track to close in mid-2018.
The transaction involves assets we know well, improves our business risk profile, leverages our strong regulatory relationships in New Jersey, enhances our path to long-term, high-quality growth and earnings accretion and provides an opportunity for enhanced utility investment via replacement of aging infrastructure.
The transactions received approval from the Federal Communications Commission (FCC) and the Federal Trade Commission (FTC) under the Hart-Scott-Rodino Act. FERC approval is pending. We filed for regulatory approval in New Jersey in December and Maryland in January, and settlement discussions have commenced.
In April, we completed an offering of equity units and common stock as part of our permanent financing plan for the acquisitions. We issued 5.75 million equity units, including overallotments, at $50 per unit, generating $279 million in net proceeds. In addition, we issued 12.7 million shares of common stock, including overallotments, at $29.50 per share. Of the offered shares, 5.9 million were offered at closing generating $168 million in net proceeds, and 6.8 million were issued under a forward sale agreement to our underwriters.
The use of a forward-sale agreement enables us to match our capital needs with actual stock issuance. SJI has the option to physically settle the forward-sale agreement by delivering all or a portion of the shares to our underwriters for cash proceeds of approximately $200 million over the next 12 months. If SJI decides we do not need any or all of the proceeds, we have the option to cash settle or net stock settle the forward sale. SJI will not receive any proceeds until such settlement.
As previously disclosed, we are currently exploring strategic opportunities regarding our remaining non-regulated businesses that are not core to our strategic plan. We expect to communicate additional progress on this process in the coming months.
Balance Sheet and Cash Flow
As evidenced by our recent financing activity, we remain committed to a strong capital structure with ample liquidity and a solid investment grade rating. At March 31, 2018, equity-to-total capitalization was 46.3 percent compared with 43.7 percent at December 31, 2017.
For the three months ended March 31, 2018, net cash from operating activities was $95.2 million compared to $79.5 million in the prior year period, reflecting strong operating performance at Energy Group. Net cash used in investing activities was $61.5 million compared with $72.8 million in the prior year period, reflecting timing of utility infrastructure upgrades and investment to support customer growth. Net cash used in financing activities was $50.3 million compared to $20.7 million in the prior year period, reflecting a larger repayment of short-term borrowings in 2018.
Our capital expenditures forecast for 2018 is $373 million, with approximately 75% of total spending on planned infrastructure investment at South Jersey Gas. We anticipate providing an update to our longer-term spending targets following completion of our pending acquisitions of ETG and Elkton later this year.
Dividends
The SJI board of directors declared a quarterly common stock dividend of $0.28 per share, payable April 3, 2018, to shareholders of record on March 19, 2018. We have continuously paid a cash dividend since 1950, with 2017 marking the 19th consecutive year of increasing dividends on an annualized basis. Our targeted payout ratio remains 55 to 70 percent of economic earnings.
Guidance
First quarter 2018 economic earnings of $100 million were exceptionally strong in both magnitude and quality. In prior years, investment tax credits (ITCs) contributed approximately 30 percent of economic earnings. However, first quarter 2018 results were instead bolstered by solid performance at South Jersey Gas and Energy Group, which successfully leveraged opportunities in our marketing and fuel management businesses. In less than three years we have replaced nearly the entire impact of ITCs through growth in our core businesses.
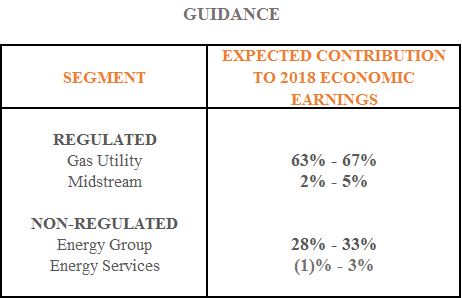
We are reaffirming our previous 2018 economic earnings guidance of $1.57 to $1.65 and standalone economic earnings guidance of $160 million by 2020, subject to the risks and uncertainties identified below under “Forward-Looking Statements.” As a reminder, we increased our 2020 economic earnings target to $160 million from $150 million in February to reflect the positive impact of federal tax reform. We expect to update guidance to include ETG and Elkton upon receipt of final regulatory approvals and closing of the acquisitions.
We continue to expect our regulated businesses to generate between 65 to 72 percent of economic earnings in 2018. Please refer to the Guidance table below for additional detail. Assuming successful completion of our pending acquisitions of ETG and Elkton, we expect our regulated businesses will generate more than 80 percent of economic earnings annually over time.
Conference Call and Webcast
SJI will host a conference call and webcast on Tuesday, May 8 to discuss its first quarter 2018 financial results. To access the call, please dial the applicable number approximately 5-10 minutes prior to the start time.
Date/Time: Tuesday, May 8, 10:00 a.m. ET
Dial-In: U.S. and Canada: 800-219-3192; International: +1-617-597-5412
Passcode: 58488114
The call will also be webcast in a listen-only format for the media and general public. The webcast can be accessed at www.sjindustries.com under Events & Presentations. A replay of the webcast will be available on our website at www.sjindustries.com under Events & Presentations.
About South Jersey Industries
South Jersey Industries (NYSE: SJI), an energy services holding company based in Folsom, NJ, delivers energy solutions to its customers through three primary subsidiaries. South Jersey Gas delivers safe, reliable, affordable natural gas and promotes energy efficiency to approximately 385,000 customers in southern New Jersey. SJI’s non-utility businesses within South Jersey Energy Solutions promote efficiency, clean technology and renewable energy by providing customized wholesale commodity marketing and fuel management services; acquiring and marketing natural gas and electricity for retail customers; and developing, owning and operating on-site energy production facilities. SJI Midstream houses the company’s interest in the PennEast Pipeline Project. Visit
http://www.sjindustries.com for more information about SJI and its subsidiaries.
Forward Looking Statements and Risk Factors
This news release contains “forward-looking statements” within the meaning of the U.S. Private Securities Litigation Reform Act of 1995. All statements other than statements of historical fact, including statements regarding future results of operations or financial position, expected sources of incremental margin, strategy, financing needs, future capital expenditures and the outcome or effect of ongoing litigation, are forward-looking. We use words such as “anticipate,” “believe,” “expect,” “estimate,” “forecast,” “goal,” “intend,” “objective,” “plan,” “project,” “seek,” “strategy,” “target”, “will” and similar expressions to identify forward-looking statements. These forward-looking statements are based on the beliefs and assumptions of management at the time that these statements were made and are inherently uncertain. Forward-looking statements are subject to risks and uncertainties that could cause actual results to differ materially from those expressed or implied in the forward-looking statements. These risks and uncertainties include, but are not limited to, general economic conditions on an international, national, state and local level; weather conditions in SJI’s marketing areas; changes in commodity costs; changes in the availability of natural gas; “non-routine” or “extraordinary” disruptions in SJI’s distribution system; regulatory, legislative and court decisions; competition; the availability and cost of capital; costs and effects of legal proceedings and environmental liabilities; the failure of customers, suppliers or business partners to fulfill their contractual obligations; and changes in business strategies and the uncertainties that the anticipated acquisitions will be completed or that they will provide the benefits we anticipate. A discussion of these and other risks and uncertainties that could cause actual results to differ materially from those expressed in the forward-looking statements are described in greater detail in the Form 10-Q for the period ended March 31, 2018 and in other filings made by us with the Securities and Exchange Commission (SEC). These cautionary statements should not be construed by you to be exhaustive and they speak only as of the date they are made. No assurance can be given that any goal or plan set forth in any forward-looking statement can or will be achieved, and readers are cautioned not to place undue reliance on such statements, which speak only as of the date they are made. SJI undertakes no obligation to revise or update any forward-looking statements, whether as a result of new information, future events or otherwise, except as required by law.
Explanation and Reconciliation of Non-GAAP Financial Measures
Management uses the non-generally accepted accounting principles (non-GAAP) financial measures of Economic Earnings and Economic Earnings per share when evaluating its results of operations. These non-GAAP financial measures should not be considered as an alternative to GAAP measures, such as net income, operating income, earnings per share from continuing operations or any other GAAP measure of liquidity or financial performance.
We define Economic Earnings as: Income from continuing operations, (i) less the change in unrealized gains and plus the change in unrealized losses on all derivative transactions; (ii) less realized gains and plus realized losses on all commodity derivative transactions attributed to expected purchases of gas in storage to match the recognition of these gains and losses with the recognition of the related cost of the gas in storage in the period of withdrawal; (iii) less the impact of transactions or contractual arrangements where the true economic impact will be realized in a future period; (iv) as adjusted by the impact of a May 2017 jury verdict stemming from a pricing dispute with a gas supplier over costs, including interest charges and legal fees incurred, along with the realized difference in the market value of the commodity (including financial hedges); and (v) as adjusted for various costs related to the agreement to acquire the assets of Elizabethtown Gas and Elkton Gas. With respect to part (iii) of the definition of Economic Earnings:
- For the three months ended March 31, 2017, Economic Earnings excludes an approximately $2.4 million pre-tax loss related to a new interest rate derivative and amendments made to an existing interest rate derivative linked to unrealized losses previously recorded in Accumulated Other Comprehensive Loss (AOCL). SJI reclassified this amount from AOCL to Interest Charges on the condensed consolidated statements of income as a result of the prior hedged transactions being deemed probable of not occurring. Since the economic impact will not be realized until future periods, this amount is excluded from Economic Earnings. See Note 12 to the condensed consolidated financial statements.
- For the three months ended March 31, 2017, Economic Earnings excludes an approximately $0.3 million pre-tax charge incurred related to an impairment charge due to a reduction in the expected cash flows to be received from a solar generating facility, for which the economic impact will not be realized until a future period. See Note 1 to the condensed consolidated financial statements. An impairment charge was also recorded in 2012 within Income from Continuing Operations on a separate solar generating facility which reduced its depreciable basis and recurring depreciation expense, and this was also excluded from Economic Earnings.
- For the three months ended March 31, 2018, there were no items that fit part (iii) of the definition of Economic Earnings.
Economic Earnings is a significant performance metric used by our management to indicate the amount and timing of income from continuing operations that we expect to earn after taking into account the impact of derivative instruments on the related transactions, those transactions or contractual arrangements where the true economic impact will be realized primarily in a future period or was realized in a previous period, and other events that management believes make period to period comparisons of SJI’s operations difficult or potentially confusing. Specifically, regarding derivatives, we believe that this financial measure indicates to investors the profitability of the entire derivative-related transaction and not just the portion that is subject to mark-to-market valuation under GAAP. We believe that considering only the change in market value on the derivative side of the transaction can produce a false sense as to the ultimate profitability of the total transaction as no change in value is reflected for the non-derivative portion of the transaction.
The following tables present a reconciliation of SJI's income from continuing operations and earnings per share from continuing operations to Economic Earnings and Economic Earnings per share for the three months ended March 31 (in thousands, except per share data):
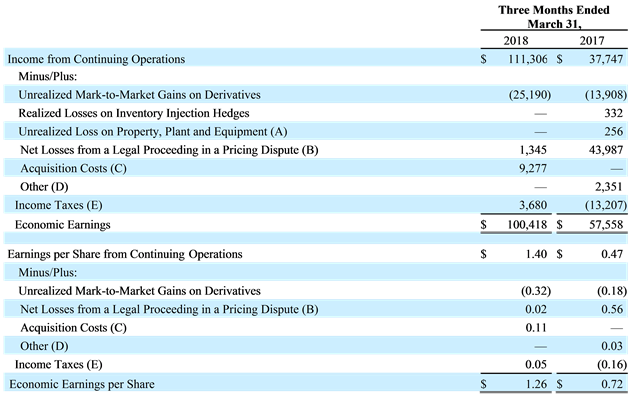
(A) Represents impairment charges taken on solar generating facilities, which was primarily driven by declining market conditions, specifically market prices of solar renewable energy credits (SRECs), and for which the economic impact will not be realized until a future period.
(B) Represents net losses, including interest, legal fees, and the realized difference in the market value of the commodity (including financial hedges), resulting from a ruling in a legal proceeding related to a pricing dispute between SJI and a gas supplier that began in October 2014. Since the net losses relate to purchase transactions that primarily occurred in prior periods, these amounts are excluded from Economic Earnings.
(C) Represents costs incurred in connection with the expected acquisition of the assets of Elizabethtown Gas and Elkton Gas.
(D) Included in this amount are amendments made to an existing interest rate derivative linked to unrealized losses previously recorded in accumulated other comprehensive income (AOCL). SJI reclassified this amount from AOCL to Interest Charges on the condensed consolidated statements of income as a result of the prior hedged transactions being deemed probable of not occurring. Since the economic impact will not be realized until future periods, this amount is excluded from Economic Earnings. Also included is additional depreciation expense within Economic Earnings on a solar generating facility where an impairment charge was recorded in the past, which reduced the depreciable basis and recurring depreciation expense, and the related reduction in depreciation expense was added back in the prior year.
(E) Determined using a combined average statutory tax rate of approximately 25% and 40% for the three months ended March 31, 2018 and 2017, respectively.
The following table summarizes Utility Margin for the three months ended March 31 (in thousands):
|
Three Months Ended
March 31, |
| |
2018 |
|
2017 |
| Utility Margin: |
|
|
|
| Residential |
$ |
96,063 |
|
|
$ |
73,446 |
|
| Commercial and Industrial |
35,643 |
|
|
26,832 |
|
| Cogeneration and Electric Generation |
995 |
|
|
1,128 |
|
| Interruptible |
129 |
|
|
4 |
|
| Off-System Sales & Capacity Release |
1,935 |
|
|
1,956 |
|
| Other Revenues |
226 |
|
|
234 |
|
| Margin Before Weather Normalization & Decoupling |
134,991 |
|
|
103,600 |
|
| CIP Mechanism |
(1,760) |
|
|
13,975 |
|
| EET Mechanism |
780 |
|
|
943 |
|
| Utility Margin** |
$ |
134,011 |
|
|
$ |
118,518 |
|
*Represents expenses for which there is a corresponding credit in operating revenues. Therefore, such recoveries have no impact on SJG's financial results.
**Utility Margin is a non-GAAP financial measure and is further defined under the South Jersey Gas section
SOUTH JERSEY INDUSTRIES, INC. AND SUBSIDIARIES
CONDENSED CONSOLIDATED STATEMENTS OF INCOME (UNAUDITED)
(In Thousands Except for Per Share Data)
| |
Three Months Ended
March 31, |
| |
2018 |
|
2017 |
| Operating Revenues: |
|
|
|
| Utility |
$ |
231,768 |
|
|
$ |
195,769 |
|
| Nonutility |
290,177 |
|
|
230,060 |
|
| Total Operating Revenues |
521,945 |
|
|
425,829 |
|
| Operating Expenses: |
|
|
|
| Cost of Sales - (Excluding depreciation) |
|
|
|
| - Utility |
87,117 |
|
|
71,379 |
|
| - Nonutility |
195,951 |
|
|
215,763 |
|
| Operations |
47,044 |
|
|
38,448 |
|
| Maintenance |
6,862 |
|
|
4,981 |
|
| Depreciation |
24,662 |
|
|
24,323 |
|
| Energy and Other Taxes |
2,439 |
|
|
2,071 |
|
| Total Operating Expenses |
364,075 |
|
|
356,965 |
|
| Operating Income |
157,870 |
|
|
68,864 |
|
| |
|
|
|
| Other Income and Expense |
2,761 |
|
|
4,487 |
|
| Interest Charges |
(13,972) |
|
|
(16,745) |
|
| Income Before Income Taxes |
146,659 |
|
|
56,606 |
|
| Income Taxes |
(36,415) |
|
|
(21,870) |
|
| Equity in Earnings of Affiliated Companies |
1,062 |
|
|
3,011 |
|
| Income from Continuing Operations |
111,306 |
|
|
37,747 |
|
| Loss from Discontinued Operations - (Net of tax benefit) |
(66) |
|
|
(30) |
|
| Net Income |
$ |
111,240 |
|
|
$ |
37,717 |
|
| |
|
|
|
| Basic Earnings Per Common Share: |
|
|
|
| Continuing Operations |
$ |
1.40 |
|
|
$ |
0.47 |
|
| Discontinued Operations |
— |
|
|
— |
|
| Basic Earnings Per Common Share |
$ |
1.40 |
|
|
$ |
0.47 |
|
| |
|
|
|
| Average Shares of Common Stock Outstanding - Basic |
79,595 |
|
|
79,519 |
|
| |
|
|
|
| Diluted Earnings Per Common Share: |
|
|
|
| Continuing Operations |
$ |
1.40 |
|
|
$ |
0.47 |
|
| Discontinued Operations |
— |
|
|
— |
|
| Diluted Earnings Per Common Share |
$ |
1.40 |
|
|
$ |
0.47 |
|
| |
|
|
|
| Average Shares of Common Stock Outstanding - Diluted |
79,724 |
|
|
79,641 |
|
| |
|
|
|
| Dividends Declared Per Common Share |
$ |
0.28 |
|
|
$ |
0.27 |
|